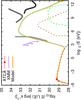
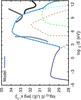
Fig. 6
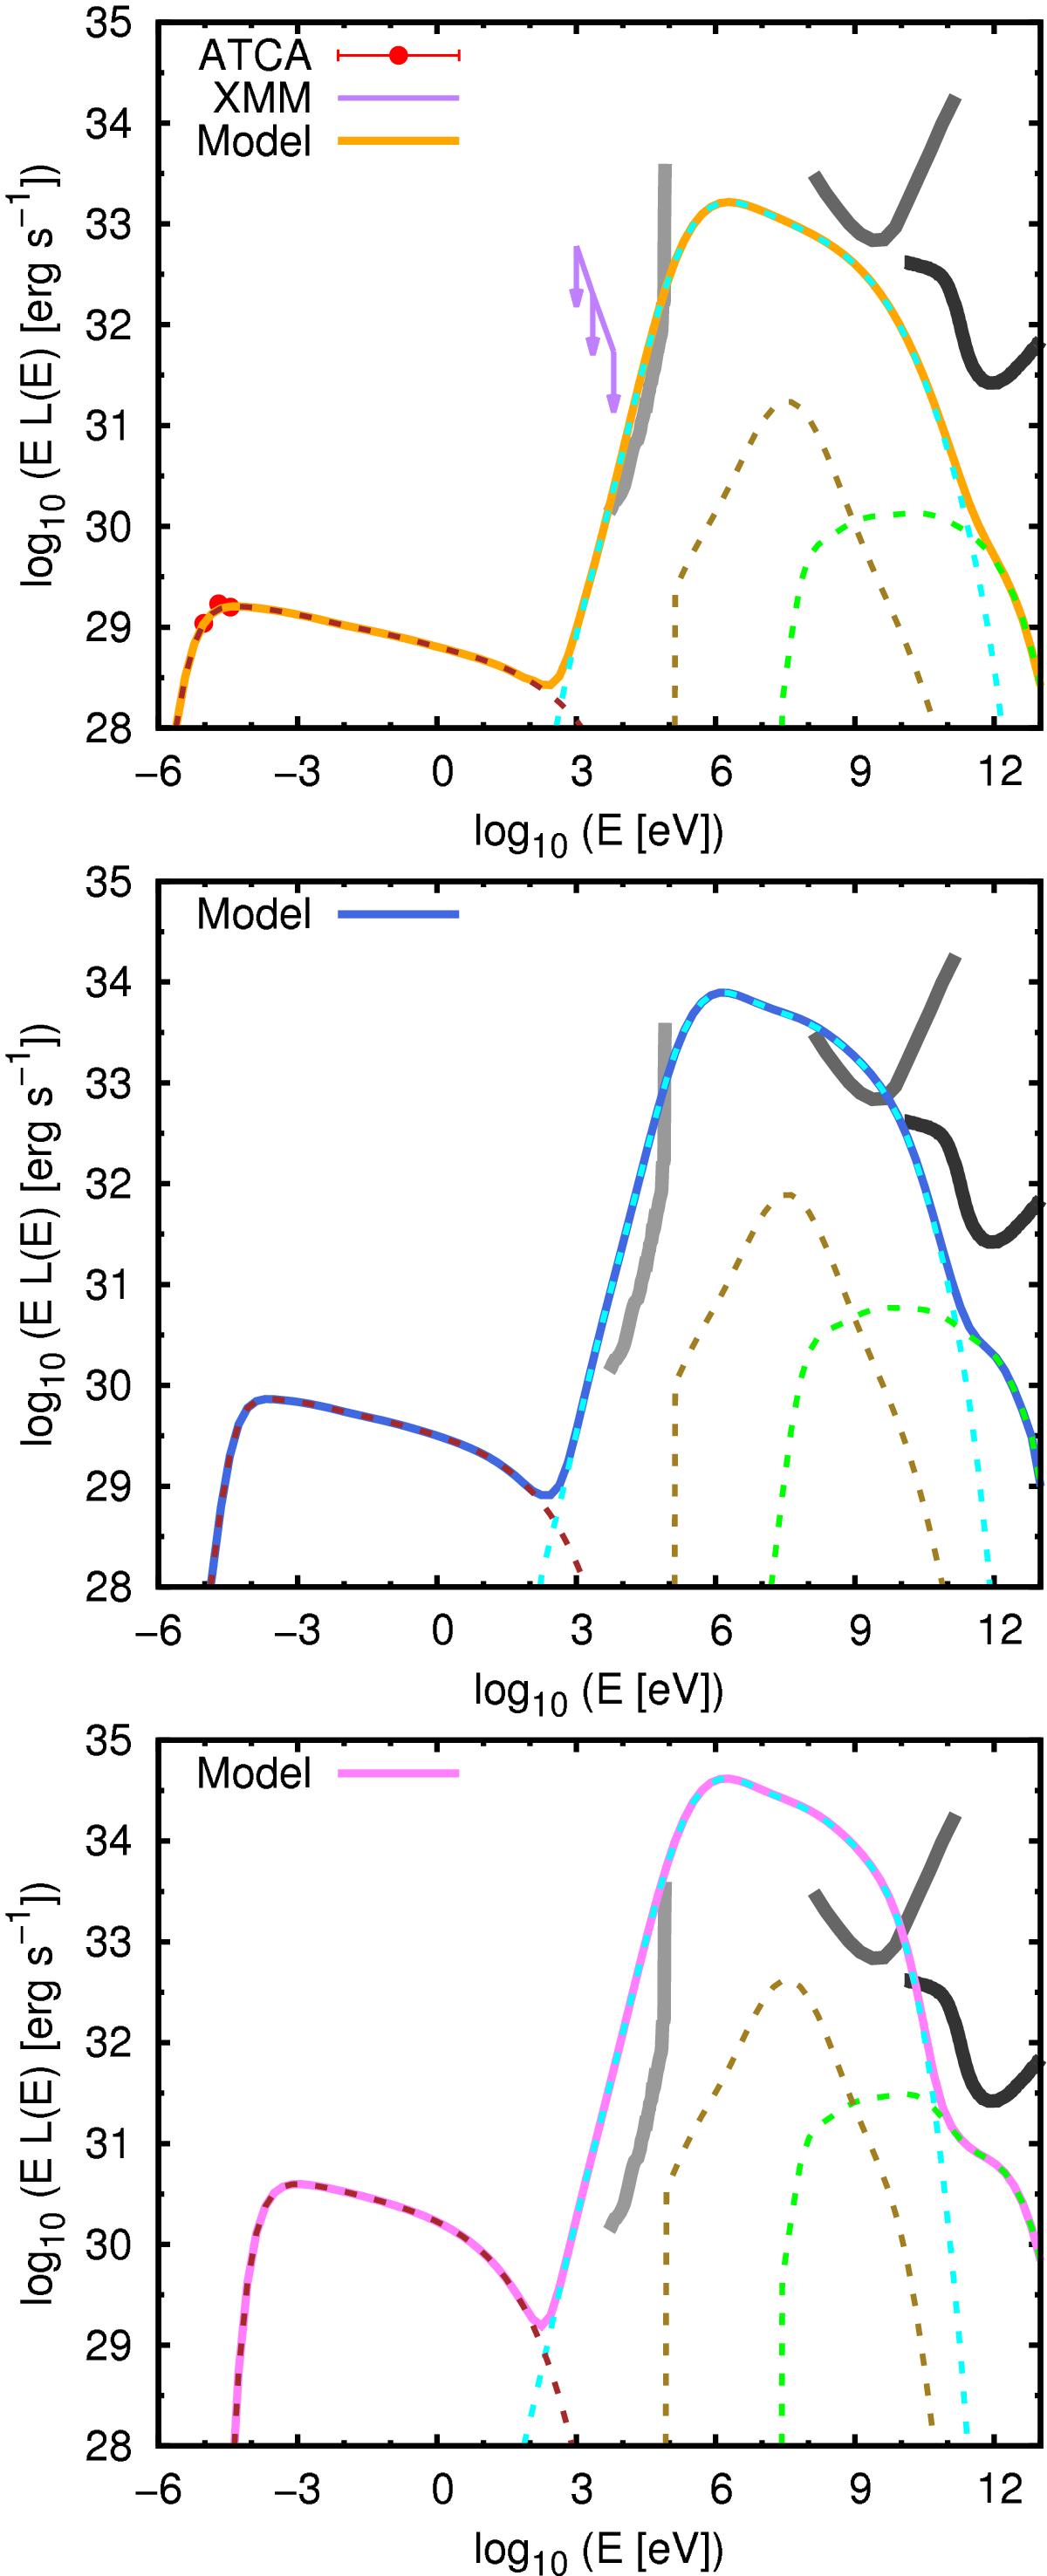
Broadband SEDs for the epoch of radio observations (top), roughly the present epoch (middle), and roughly the periastron passage (bottom). For the epoch of radio observations, we show the ATCA data from 2008–2009, and upper-limits in the X-ray flux derived from Benaglia et al. (2006). Dashed lines indicate contributions from synchrotron (brown), IC (cyan), relativistic Bremsstrahlung (olive), and p-p (green); the filled red curve is the total emission. We show instrument sensitivity curves for 1-Ms NuSTAR (gray), 4-yr Fermi (dark gray), and 50-h CTA (black).
Current usage metrics show cumulative count of Article Views (full-text article views including HTML views, PDF and ePub downloads, according to the available data) and Abstracts Views on Vision4Press platform.
Data correspond to usage on the plateform after 2015. The current usage metrics is available 48-96 hours after online publication and is updated daily on week days.
Initial download of the metrics may take a while.