Fig. 4
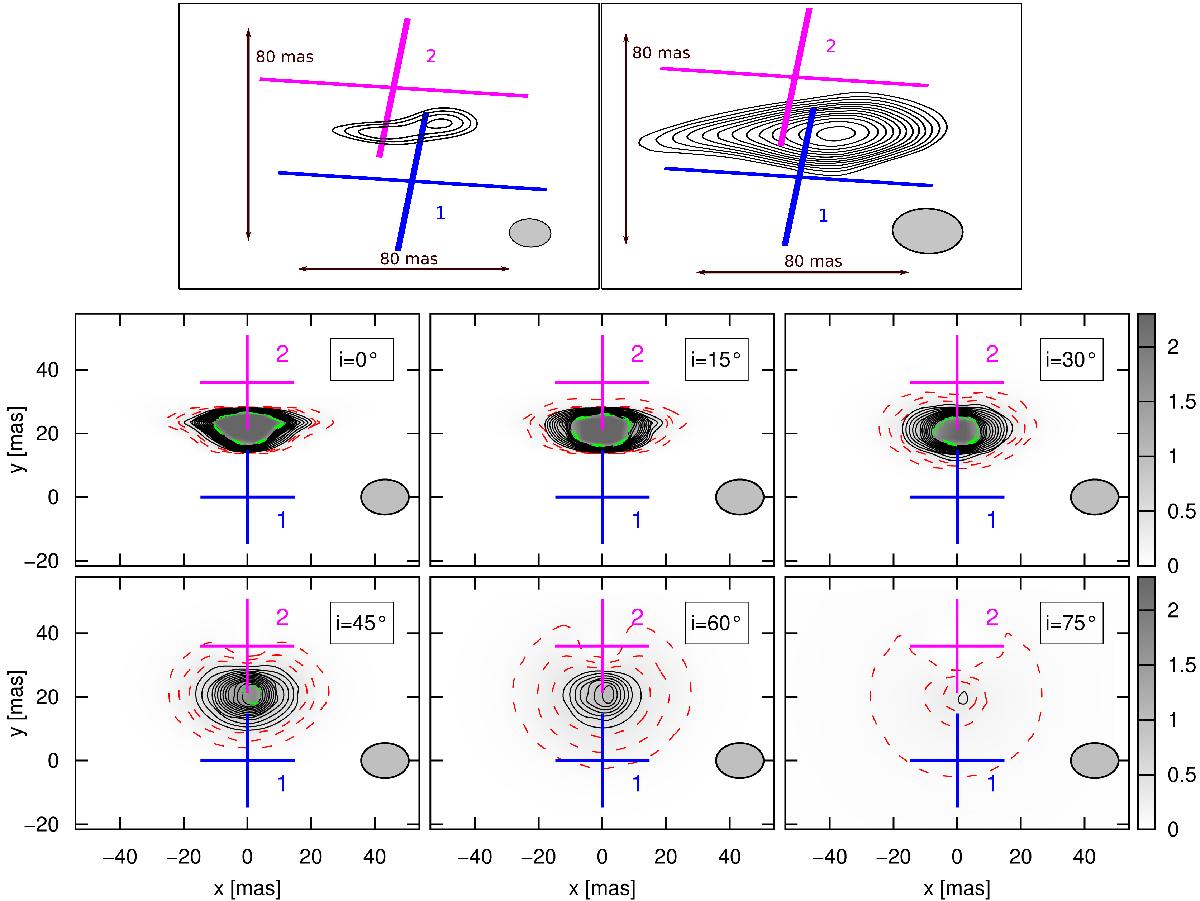
Comparison between the observed radio emission map at 2.3 GHz (top, adapted from Benaglia et al. 2015) and our synthetic maps for the same binary separation as in the epoch of LBA observations. The two observed maps have different synthesized beams: the one on the left has a better resolution but a poorer sensitivity, whereas the one on the right has a poorer resolution but a higher sensitivity. In the synthetic maps, different values of the inclination of the orbit, ranging from 0° to 75°, are considered. The color bar represents the flux in units of mJy beam-1. The contours from the observed map start at 0.4 mJy beam-1 and increase in steps of 0.1 mJy beam-1, with a maximum value of 1.6 mJy beam-1 (right). In the synthetic maps, along with these contours, we show the contours at 0.1, 0.2 and 0.3 mJy beam-1 (below the 3σ threshold of the observations) in red, and the contours at 1.8, 2.0 and 2.2 mJy beam-1 (above the observed values) in green. Cases where i> 60° completely fail to reproduce the observed maps. The best fit is achieved for low inclinations (i< 30°).
Current usage metrics show cumulative count of Article Views (full-text article views including HTML views, PDF and ePub downloads, according to the available data) and Abstracts Views on Vision4Press platform.
Data correspond to usage on the plateform after 2015. The current usage metrics is available 48-96 hours after online publication and is updated daily on week days.
Initial download of the metrics may take a while.