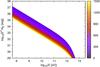
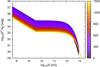
Fig. 3
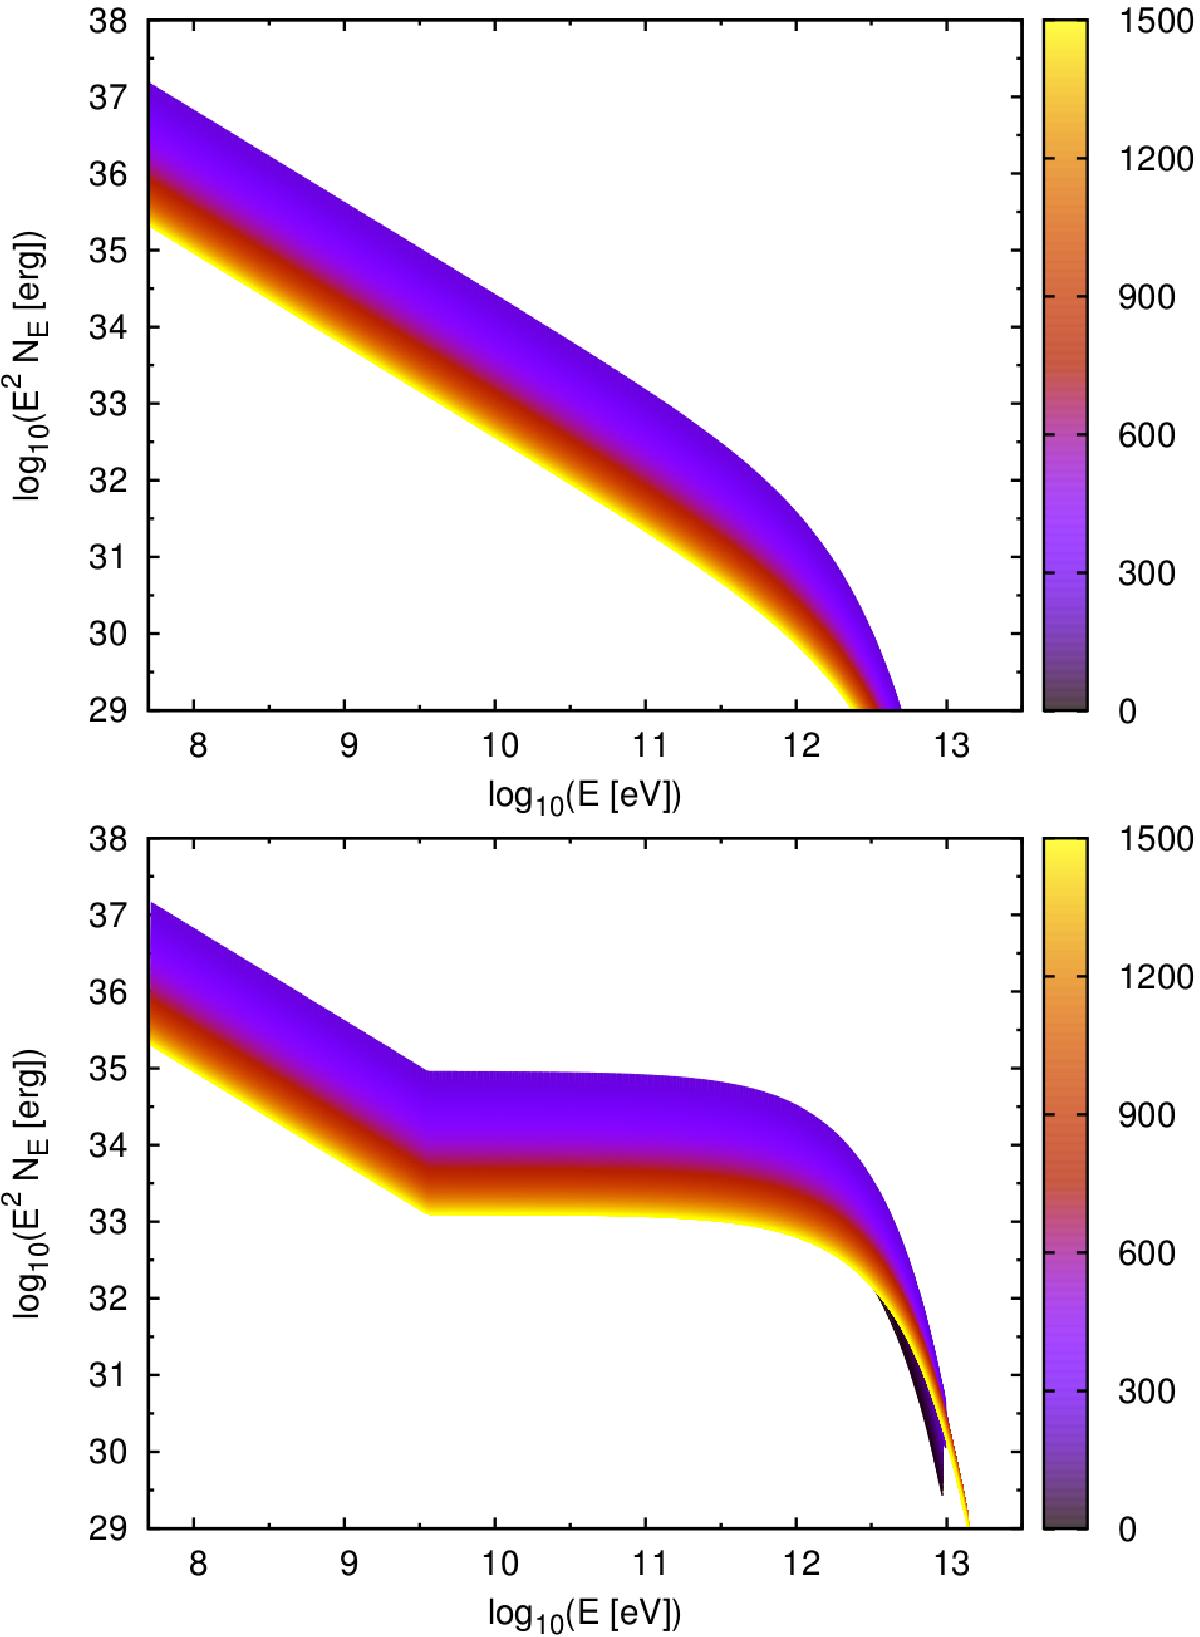
Examples of the electron energy distribution for a set of linear-emitters assuming a constant spectral index (top), and a hardening at higher energies (bottom). The color bar corresponds to different positions along the line, with higher values meaning farther from the apex. Both cases correspond to a low ambient magnetic field (ζ ≪ 1).
Current usage metrics show cumulative count of Article Views (full-text article views including HTML views, PDF and ePub downloads, according to the available data) and Abstracts Views on Vision4Press platform.
Data correspond to usage on the plateform after 2015. The current usage metrics is available 48-96 hours after online publication and is updated daily on week days.
Initial download of the metrics may take a while.