Fig. 2
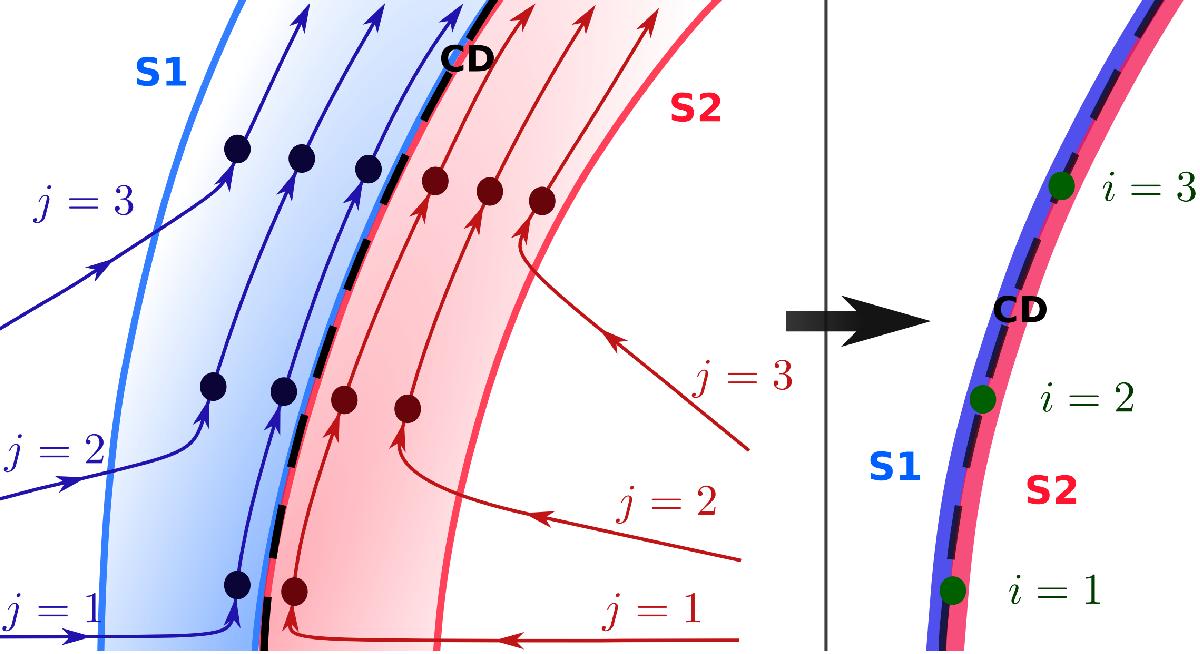
Illustration of the model for the spatial distribution of NT particles in the WCR. On the left side we show different linear-emitters, named as j = 1,2,3, coming from each star. On the right side we represent a set of linear-emitters, obtained from summing the contributions from the different linear-emitters at each location (see text).
Current usage metrics show cumulative count of Article Views (full-text article views including HTML views, PDF and ePub downloads, according to the available data) and Abstracts Views on Vision4Press platform.
Data correspond to usage on the plateform after 2015. The current usage metrics is available 48-96 hours after online publication and is updated daily on week days.
Initial download of the metrics may take a while.