Free Access
Fig. 9
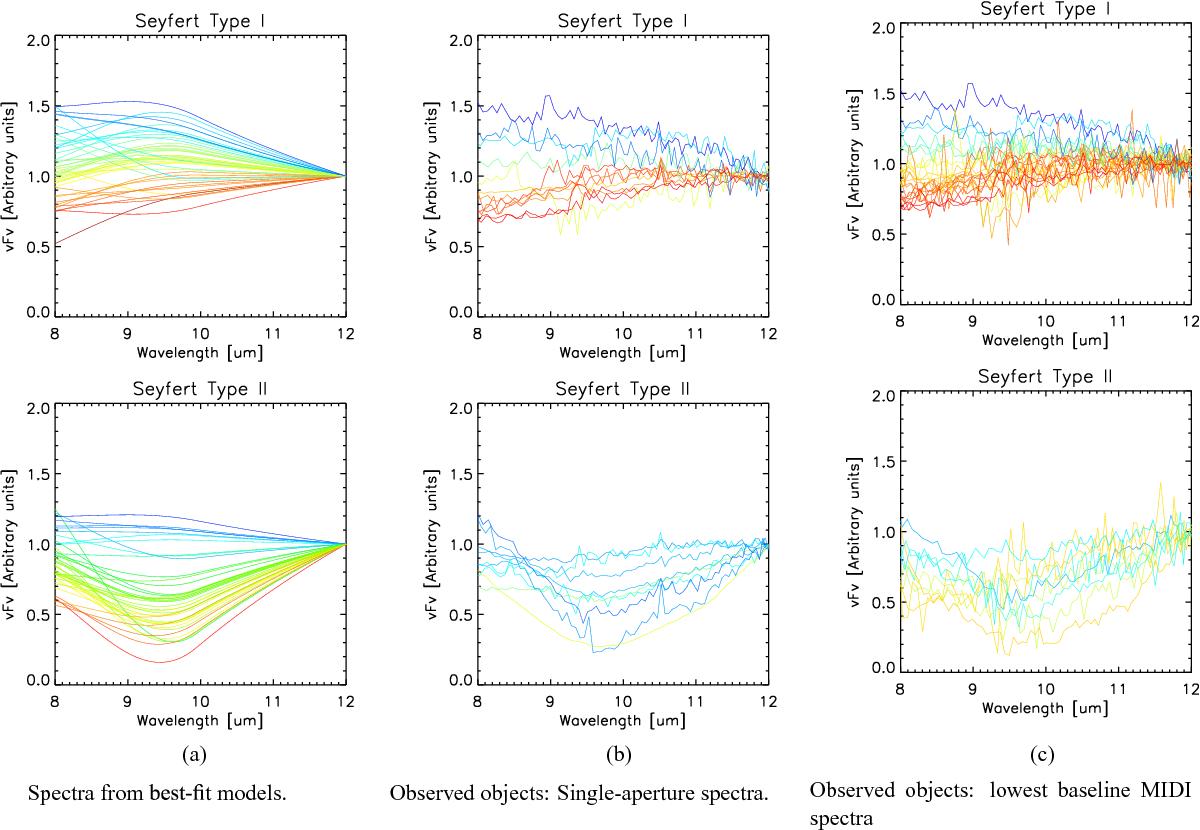
N-band spectra for type 1 objects (top row) and type 2 objects (bottom row). The spectra have been normalized to the 12 μm flux. The colors indicate the slope of the continuum, warm spectra are given.
Current usage metrics show cumulative count of Article Views (full-text article views including HTML views, PDF and ePub downloads, according to the available data) and Abstracts Views on Vision4Press platform.
Data correspond to usage on the plateform after 2015. The current usage metrics is available 48-96 hours after online publication and is updated daily on week days.
Initial download of the metrics may take a while.