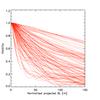
Fig. 4
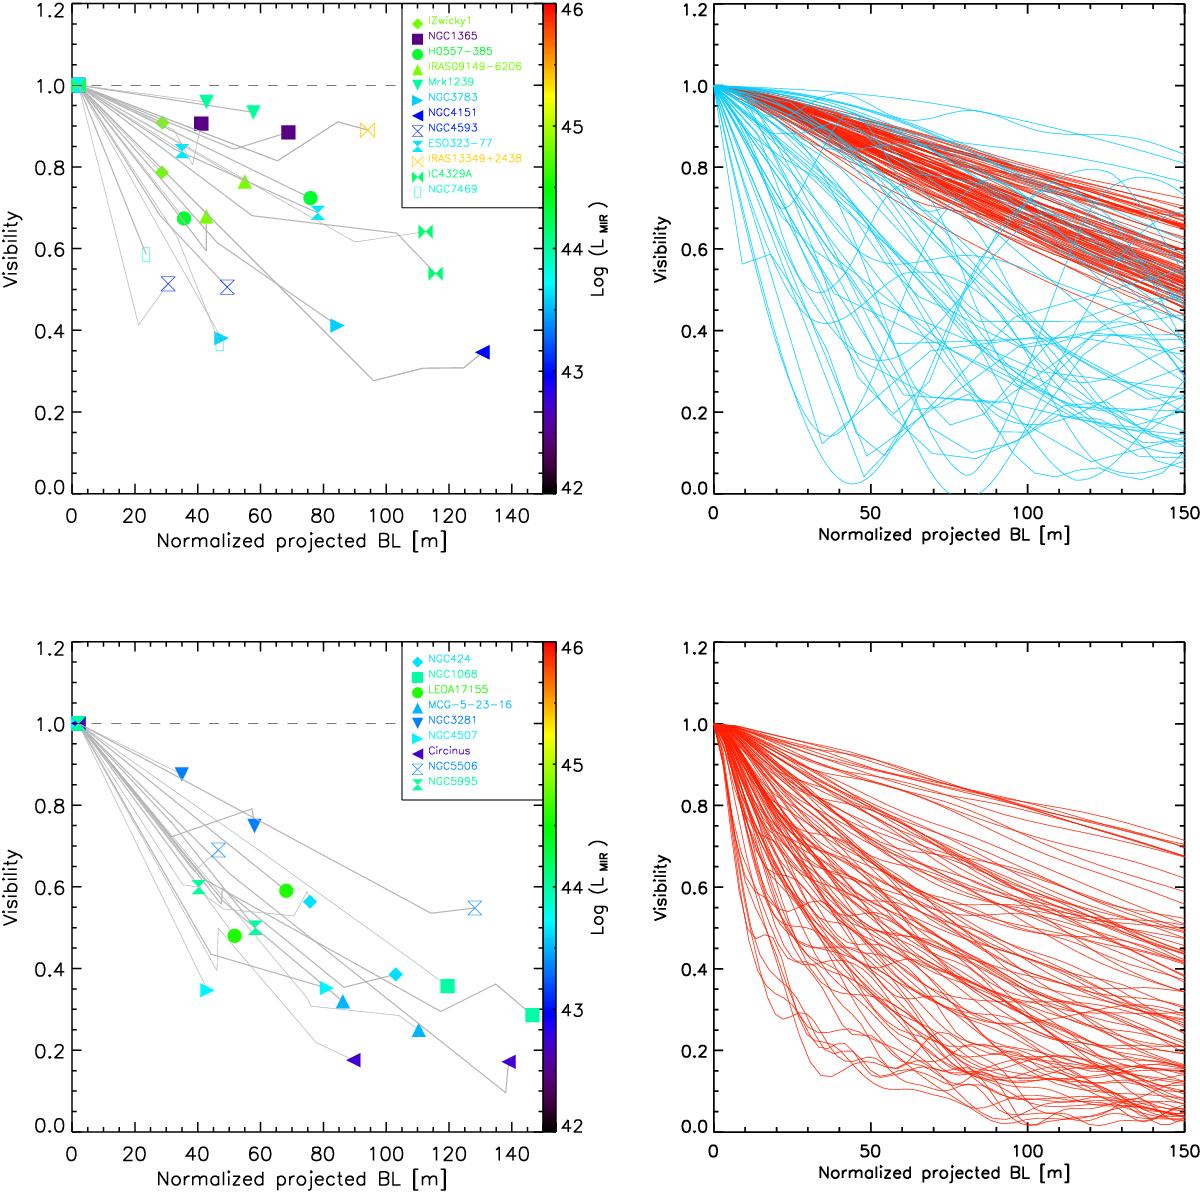
Left: 12 μm interferometric visibilities of type 1 (top) and type 2 sources (bottom) plotted against the normalized projected baseline. For every object we include visibilities for two different position angles connected by independent lines. The normalized baseline is scaled from the observed baseline for each source to normalize its single-aperture 12 μm flux; cf. Sect. 4.1. Each symbol indicates the longest baseline data point available at the given position angle for an individual object. The color of the symbols indicates the value of the infrared luminosity of the source as shown on the scale at the right, data are from by Table 1. Top right: model normalized 12 μm interferometric radial plots for various lines of sight where the nucleus is exposed, corresponding to type 1 objects, computed from type A models (blue) and from type B models (red). Bottom right: model radial plots for various obscured LOS, corresponding to type 2 objects, computed for the best type B models.
Current usage metrics show cumulative count of Article Views (full-text article views including HTML views, PDF and ePub downloads, according to the available data) and Abstracts Views on Vision4Press platform.
Data correspond to usage on the plateform after 2015. The current usage metrics is available 48-96 hours after online publication and is updated daily on week days.
Initial download of the metrics may take a while.