Fig. 2
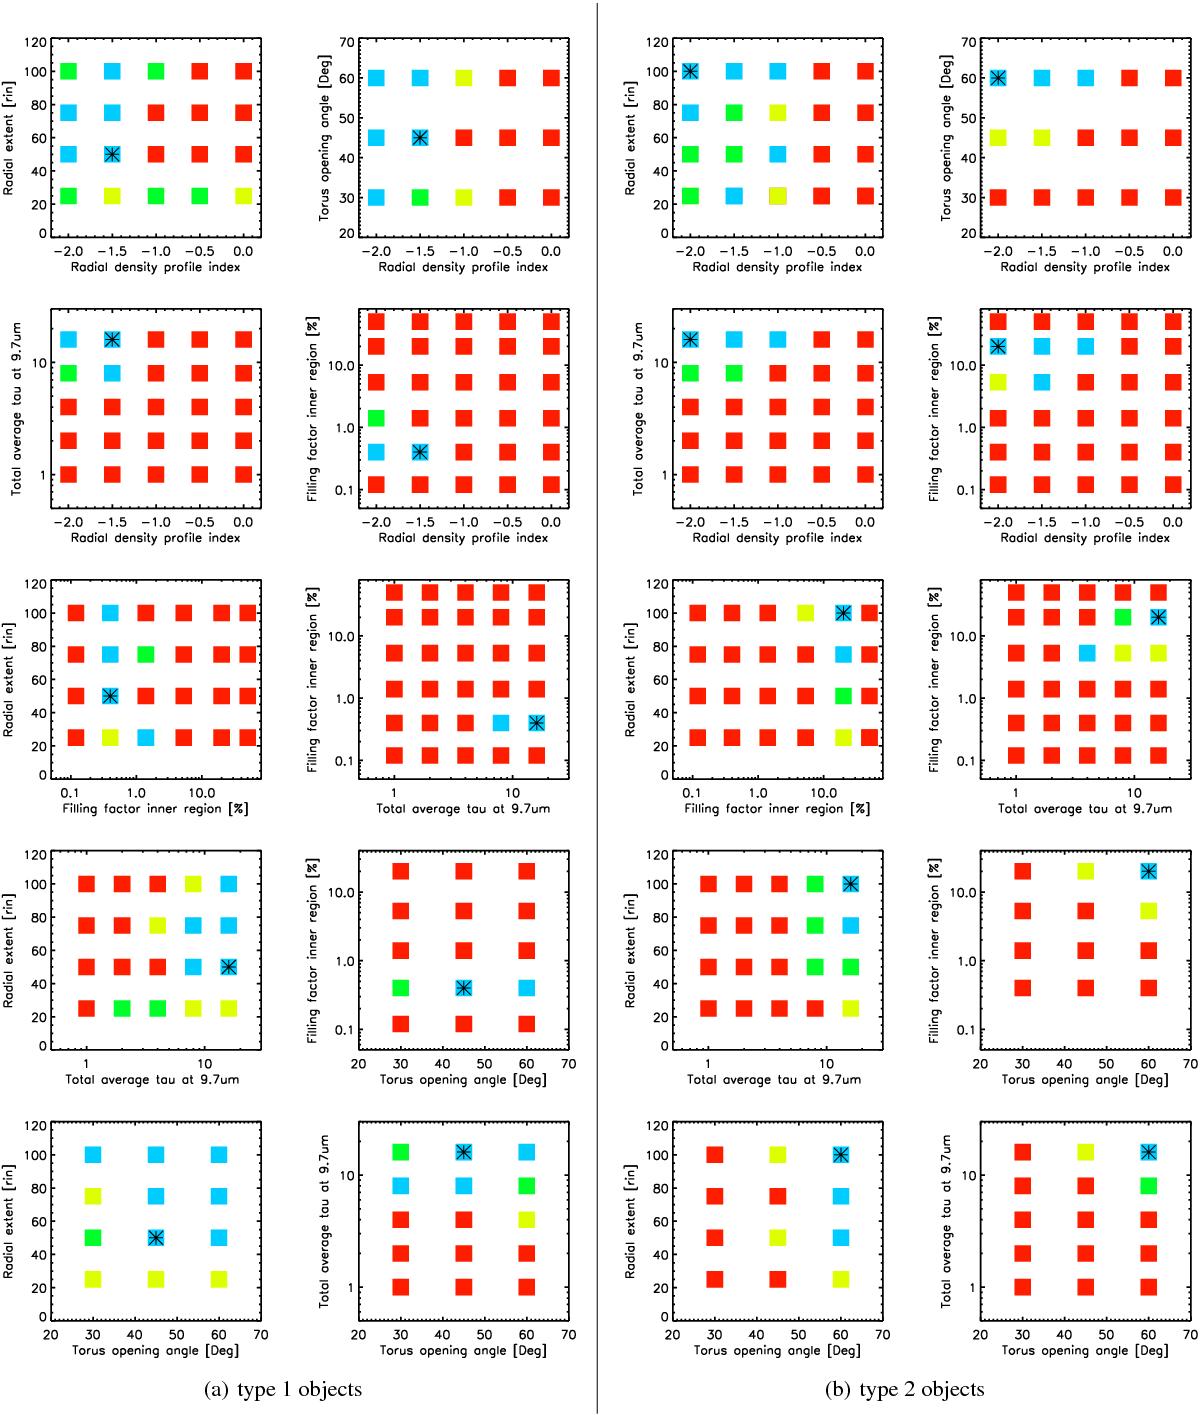
Discrete maps showing the level of acceptance around the best-fit solution for type 1 sources (first and second column) and type 2 sources (second and third column). In every panel, three of the five parameters of the best solution are kept fixed, while the two parameters shown in the labels of each plot are explored. The best-fit solution is shown with an asterisk. The color of the squares indicates the acceptance value of the parameters based on a χ2-test. The blue squares indicate the probability of the χ2-value using the equivalent percentages of a Gaussian distribution at the 1σ level (68%), green the probability at 95% confidence, yellow up to 99.5% and red above 99.5%.
Current usage metrics show cumulative count of Article Views (full-text article views including HTML views, PDF and ePub downloads, according to the available data) and Abstracts Views on Vision4Press platform.
Data correspond to usage on the plateform after 2015. The current usage metrics is available 48-96 hours after online publication and is updated daily on week days.
Initial download of the metrics may take a while.