Fig. 10
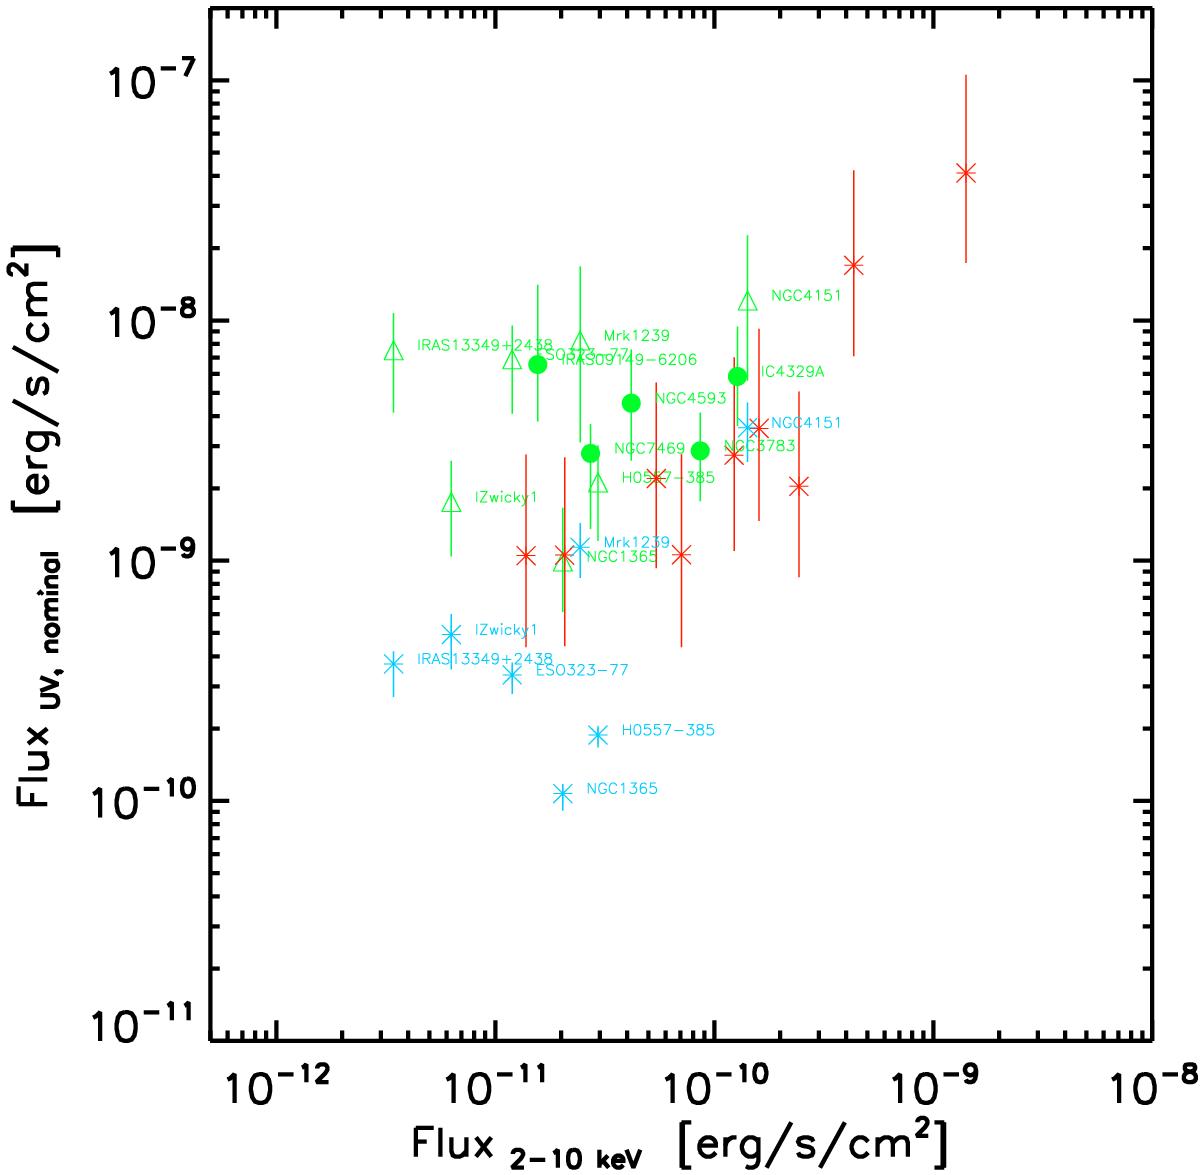
Absorption-corrected 2−10 keV X-ray flux versus nuclear UV flux estimated from models. The symbols indicate the median value for the estimated UV luminosities from their respective best-fit models, and the lines indicate the dispersion (68% area) in the possible values. Type I galaxies that can only be fit with type A models (filling factors 0.4−1.4%) are given as filled circles. Those that can also be fit by type B models (filling factors 5.3−20%) are shown twice, with the model UV-flux values given as triangles (model A) and asterisks (model B). All type 2 galaxies are shown as asterisks.
Current usage metrics show cumulative count of Article Views (full-text article views including HTML views, PDF and ePub downloads, according to the available data) and Abstracts Views on Vision4Press platform.
Data correspond to usage on the plateform after 2015. The current usage metrics is available 48-96 hours after online publication and is updated daily on week days.
Initial download of the metrics may take a while.