Fig. 2
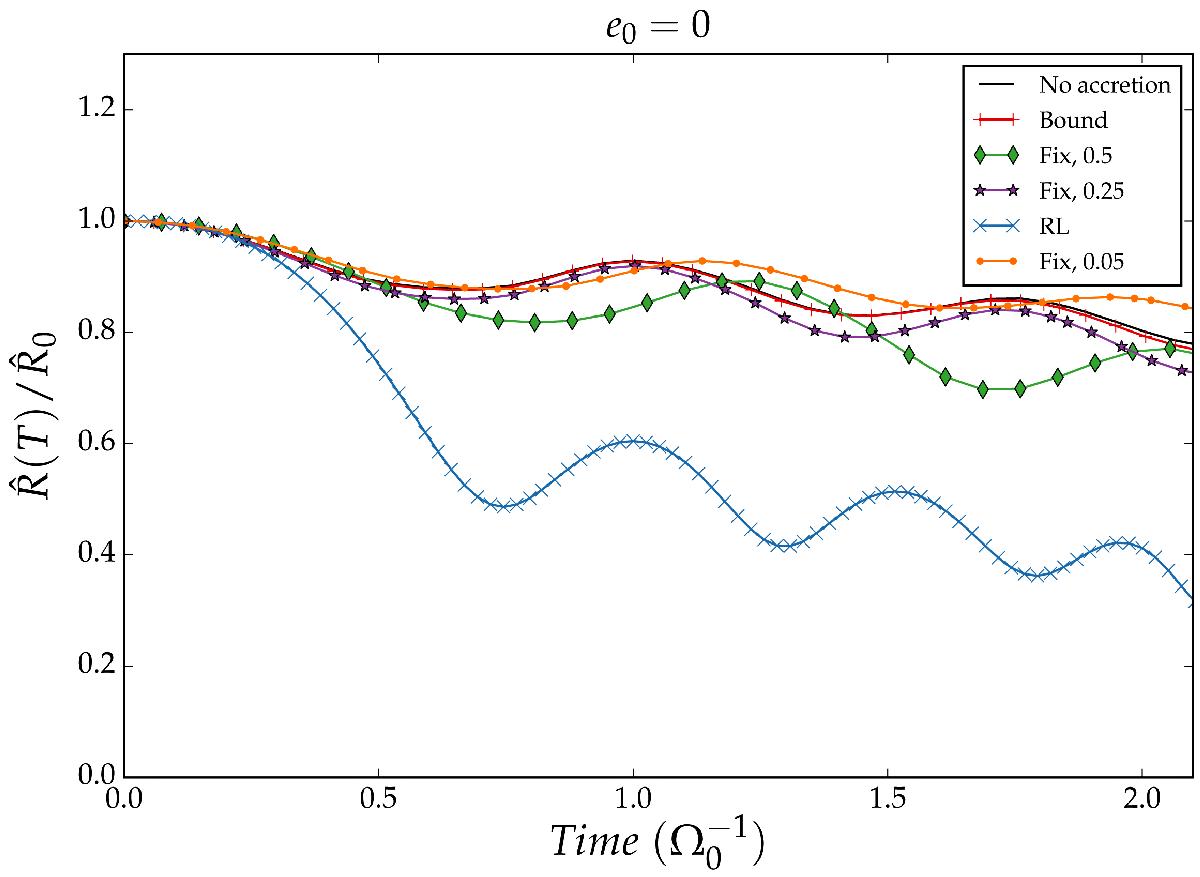
Relative MBH orbital separation (in units of the initial separation) as a function of time in units of ![]() for a binary with initial eccentricity e0 = 0. Only the first ~2 orbits are shown to highlight the differences in the orbital evolution caused by the different accretion prescriptions. Black solid line refers to the run without any implementation of accretion onto the secondary (the no-accretion model). The red plus line refers to the Bound model and the blue crosses line to the RL model (lowest line). Green diamonds, purple stars, and orange circles refer to the Fix models with sink radii Rfix = 0.5, 0.25, and 0.05, respectively.
for a binary with initial eccentricity e0 = 0. Only the first ~2 orbits are shown to highlight the differences in the orbital evolution caused by the different accretion prescriptions. Black solid line refers to the run without any implementation of accretion onto the secondary (the no-accretion model). The red plus line refers to the Bound model and the blue crosses line to the RL model (lowest line). Green diamonds, purple stars, and orange circles refer to the Fix models with sink radii Rfix = 0.5, 0.25, and 0.05, respectively.
Current usage metrics show cumulative count of Article Views (full-text article views including HTML views, PDF and ePub downloads, according to the available data) and Abstracts Views on Vision4Press platform.
Data correspond to usage on the plateform after 2015. The current usage metrics is available 48-96 hours after online publication and is updated daily on week days.
Initial download of the metrics may take a while.