| Issue |
A&A
Volume 590, June 2016
|
|
|---|---|---|
| Article Number | L4 | |
| Number of page(s) | 5 | |
| Section | Letters | |
| DOI | https://doi.org/10.1051/0004-6361/201628297 | |
| Published online | 19 May 2016 | |
Discovery of an exceptionally bright giant arc at z = 2.369, gravitationally lensed by the Planck cluster PSZ1 G311.65−18.48 ⋆⋆
1 Institute of Theoretical Astrophysics, University of Oslo, PO Box 1029, Blindern, 0315 Oslo, Norway
e-mail: hdahle@astro.uio.no
2 Institut d’Astrophysique Spatiale, CNRS, Université Paris-Sud, Université Paris-Saclay, Bât. 121, UMR 8617, 91405 Orsay Cedex, France
3 Sorbonne Universités, UPMC Univ. Paris 06, UMR d’Astrophysique de Paris, 75014 Paris, France
4 European Southern Observatory, ESO Vitacura, Alonso de Cordova 3107, Vitacura, Casilla 19001, Santiago, Chile
5 Atacama Large Millimeter/submillimeter Array, ALMA Santiago Central Offices, Alonso de Cordova 3107, Vitacura, Casilla 763- 0355, Santiago, Chile
6 Université de Toulouse, UPS-Observatoire Midi-Pyrénées, IRAP, 31000 Toulouse, France
7 CNRS, Institut de Recherche en Astrophysique et Planétologie (IRAP), 9 avenue Colonel Roche, 31028 Toulouse Cedex 4, France
8 Colby College, 5800 Mayflower Hill, Waterville, 04901 Maine, USA
9 Harvard-Smithsonian Center for Astrophysics, 60 Garden Street, Cambridge, MA, 02138, USA
10 Department of Physics, Harvard University, 17 Oxford Street, Cambridge, MA 02138, USA
11 Departemento de Ciencias Fisicas, Universidad Andres Bello, Campus Casona de Las Condes, Fernández Concha 700, Santiago, Chile
12 Space Research Institute (IKI), Russian Academy of Sciences, Profsoyuznaya Str, 84/32, 117997 Moscow, Russia
13 Moscow Institute of Physics and Technology, Dolgoprudny, Institutsky per., 9, 141700 Dolgoprudry, Russia
14 Kavli Institute for Cosmology Cambridge, Madingley Road, Cambridge, CB3 0HA, UK Institute of Astronomy, Madingley Road, Cambridge, CB3 0HA, UK
15 Dipartimento di Fisica, Università degli Studi di Roma Tor Vergata, via della Ricerca Scientifica 1, 00133 Roma, Italy
16 Max-Planck-Institut für Astrophysik, Karl-Schwarzschild-Str. 1, 85741 Garching, Germany
Received: 11 February 2016
Accepted: 21 March 2016
As part of an all-sky follow-up of the Planck catalogue of Sunyaev-Zeldovich (SZ) cluster candidates detected in the first 14 months of data, we are observing cluster candidates in the southern sky in the optical imaging and spectroscopy through an ESO Large Programme. Inspection of ESO New Technology Telescope (NTT) R-and z-band imaging data from our programme has revealed an unusually large and bright arc in the field of PSZ1 G311.65−18.48. We establish the basic photometric and morphological properties of the arc and provide conclusive evidence for the gravitational lensing nature of this object. Guided by the NTT images, we have obtained a long-slit spectrum with IMACS on the Magellan-I Baade Telescope, covering a part of the arc and the brightest cluster galaxy of PSZ1 G311.65−18.48. Our imaging data confirm the presence of a galaxy cluster coinciding (within 0.́6) with the position of the Planck SZ source. The arc is separated by ~30″ from the brightest cluster galaxy, which closely coincides with the center of curvature of the arc. A photometric analysis yields integrated (Vega) magnitudes of (R,z,J,Ks) = (17.82,17.38,16.75,15.43) for the arc, more than one magnitude brighter than any previously known lensed arc at z ~ 2–3. The arc is a vigorously star-forming galaxy at z = 2.369, while the Planck SZ cluster lens is at z = 0.443.Even when allowing for lensing magnifications as high as μ = 100 still leads to the conclusion that the source galaxy is among the intrinsically most luminous normal (i.e., non-AGN) galaxies known at z ~ 2–3.
Key words: galaxies: clusters: individual: PSZ1 G311.65-18.48 / gravitational lensing: strong / cosmology: observations
FITS files of all the reduced images are only available at the CDS via anonymous ftp to cdsarc.u-strasbg.fr (130.79.128.5) or via http://cdsarc.u-strasbg.fr/viz-bin/qcat?J/A+A/590/L4
© ESO, 2016
1. Introduction
In the three decades since the first discoveries of strongly gravitationally lensed arcs (Soucail et al. 1987; Lynds & Petrosian 1989), strong gravitational lensing has emerged as a highly important tool for studies of distant galaxies. The magnification and associated amplification caused by lensing has provided a rich source of information about source galaxies at spatial and spectral resolutions that would otherwise be unobtainable. The typical blue arcs found in ground-based imaging surveys are vigorously star-forming galaxies in the redshift interval 1 ≲ z ≲ 3 (Bayliss et al. 2011), where the strong rest-frame UV flux has been redshifted into optical bands. A handful of very bright arcs have integrated magnitudes of r ~ 19–20 (Hammer et al. 1989; Yee et al. 1996; Allam et al. 2007; Smail et al. 2007; Belokurov et al. 2007; Koester et al. 2010); the current record holder is RCS GA032727−132609 with an integrated (AB) magnitude r = 19.1 (Wuyts et al. 2010).
We report here on the discovery of an exceptionally bright arc, spanning a total length along its path of 55′′. The arc was identified in ESO New Technology Telescope (NTT) follow-up imaging of the galaxy cluster PSZ1 G311.65−18.48 , which was detected through its Sunyaev-Zeldovich (SZ) effect (Sunyaev & Zeldovich 1972) in the ESA Planck survey (Planck Collaboration XXIX 2014).
Throughout this letter, a flat ΛCDM cosmology is assumed with ΩM = 0.3 and H0 = 70 km s-1 Mpc-1. Photometric measurements are given in the Vega magnitude system throughout the paper, unless otherwise noted.
2. ESO follow-up programme of Planck SZ clusters
The Planck all-sky survey has provided a significant number of sources detected by means of their SZ decrements over the entire extragalactic sky (Planck Collaboration VIII 2011; Planck Collaboration XXIX 2014; Planck Collaboration XXVII 2015). To confirm their detection as galaxy clusters, extensive follow-up programmes of the cluster candidates were undertaken using optical telescopes (Planck Collaboration Int. XXVI 2015; Planck Collaboration Int. XXXVI 2016; van der Burg et al. 2016), with the aim of achieving full redshift determination for the Planck Collaboration XXIX (2014) sample (hereafter PSZ1), in particular over the 65% of the sky that is least affected by Galactic foregrounds. In the southern hemisphere, we are conducting an ongoing ESO Large Programme (PI: N. Aghanim, “A Planck/ESO legacy sample of the most massive clusters”) for which imaging of 120 PSZ1 cluster candidates is performed using the EFOSC2 instrument at NTT (Aghanim et al., in prep.). Using the R−z colour of the red sequence of passively evolving galaxies (Gladders & Yee 2000), we identify the subset of SZ cluster candidates that are confirmed to be real clusters at z> 0.5. This subsample is subsequently targeted for Very Large Telescope (VLT) multi-object spectroscopy to obtain spectroscopic redshifts and velocity dispersion for the clusters.
The SZ cluster candidate PSZ1 G311.65−18.48 was detected at S/N = 4.64 as part of the PSZ1 catalogue (Planck Collaboration XXIX 2014). This candidate is noted as a CLASS2 detection, i.e. it is one of 170 PSZ1 detections that fulfill good or high-quality criteria either in the Planck SZ data, the ROSAT All-Sky Survey (RASS), or in data from the Wide-Field Infrared Survey Explorer (WISE), without simultaneously fulfilling all of these criteria. This candidate is also noted as having possible contamination by a radio source. The low significance of the PSZ1 G311.65−18.48 detection, which is close to the PSZ1 threshold (S/N = 4.5), has resulted in the downwards fluctuation in the Planck data, as the cluster is not included in the SZ catalogue based on the 29-month, full-mission Planck data (Planck Collaboration XXVII 2015). PSZ1 G311.65−18.48 is located in a region of moderate Galactic extinction (E(B−V) = 0.083; Schlafly & Finkbeiner 2011) and relatively high foreground star density (Fig. 1), which makes the cluster difficult to identify in archival images from the Digitized Sky Survey.
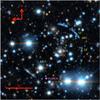 |
Fig. 1 Colour image of the cluster lens and arc, generated from the NTT/EFOCS2 R-and z-band images. The locations of the BCG and arc segments S1-S3 are indicated; the location of a candidate arc at the opposite side of the BCG and the positions of the Planck SZ source and the X-ray source from the RASS Faint Source Catalogue are shown. |
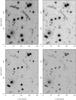 |
Fig. 2 Top row: NTT/EFOSC2 R- (left) and z-band close-up images of PSZ1-ARC G311.6602−18.4624. Bottom row: Magellan/FourStar J- and Ks-band images covering the same area. The dotted lines in the upper left panel indicate the slit position used for the spectroscopic observations described in Sect. 3.3. |
3. Observations
3.1. Optical imaging
The Planck SZ cluster candidate PSZ1 G311.65−18.48 was observed using EFOSC2 at ESO NTT in imaging mode on 2014 March 28 UT, using the Bessel R and Gunn z filter, with 3 × 400 s exposure time in each band. The imaging data were de-biased, flat-fielded and combined using standard methodology. The seeing values measured in the combined R- and z-band images are  and
and  , respectively.
The NTT images reveal a galaxy cluster with a central brightest cluster galaxy (BCG) offset by 36′′ from the Planck SZ detection (see Fig. 1). This is well within the median angular separation of  between the real and estimated positions of PSZ1 clusters (Planck Collaboration XXIX 2014). An X-ray source 1RXS J155007.1−781134, which is listed in the RASS Faint Source Catalogue (Voges et al. 2000), is located 4′′ from the BCG (cf. Fig. 1) and is likely associated with the cluster.
The most striking feature is a long thin arc, visible to the northwest of the BCG and separated from it by 25′′ and 34′′, respectively, at its two end points. We designate the arc PSZ1-ARC G311.6602−18.4624, which is derived from the position in Galactic coordinates of its maximum R-band surface brightness peak. This is similar to the nomenclature used for Planck SZ sources, but has two extra digits to reflect the higher positional accuracy. Relative to the position of the BCG, the total azimuthal extent of the arc is 108°. The upper left panel of Fig. 2 shows a close-up of the NTT R-band image in the region of the arc. The arc is unresolved or barely resolved, with a full width at half maximum (FWHM) along the radial direction of ~ . PSZ1-ARC G311.6602−18.4624 has three brighter segments (S1-S3, listed in Table 1). The R-band image, in which the signal-to-noise of the arc is highest, reveals the arc to be contiguous, or nearly so: An azimuthally averaged (i.e. along the direction of the arc) flux measurement in the 8′′ gap between S2 and S3, while simultaneously averaging in bins of 3 pixels (
 ) in width in the radial direction, yields a 5.8σ excess in flux, compared to the adjacent blank sky regions outside and inside the radius of the arc. This corresponds to a surface brightness of ~1% of the peak value of the arc. Faint flux in the 3′′ gap between S1 and S2 cannot unambiguously be associated with the arc owing to neighbouring foreground objects. Each of the brighter segments consists of multiple bright knots, which we interpret as unresolved star-forming clumps within the source galaxy.
To measure the flux of PSZ1-ARC G311.6602−18.4624, we run SExtractor (Bertin & Arnouts 1996) in dual-image mode on the stacked R- and z-band images (where the z-band image was smoothed to match the resolution of the R-band image) with the R-band image as a reference for object detection. A total of nine clumps are detected along the arc with a total combined flux that yields observed magnitudes R = 17.82 and z = 17.38 (corresponding to R = 17.62 and z = 17.26, respectively, after correcting for Galactic extinction).
Astrometric and photometric properties of the three bright segments of PSZ1-ARC G311.6602−18.4624.
We also note that because of the extreme brightness of the arc, seven clumps along the arc are detected as individual objects in the USNO-B1.0 catalogue (Monet et al. 2003) with combined magnitudes R2 = 17.2 and B2 = 16.9.
3.2. Infrared imaging
To further characterize PSZ1-ARC G311.6602−18.4624, imaging in the J and Ks-bands was performed using the FourStar instrument on the Magellan-I Baade Telescope, with total exposure times of 2100 s and 800 s, respectively. The seeing values measured in the combined images were  (J-band) and
  (Ks-band). Close-up images of the arc are shown in the lower panels of Fig. 2. Photometry was performed by smoothing the J- and Ks-band images to the resolution of the R-band image and running SExtractor in dual detect mode with the R-band image as the reference for object detection. The photometric measurements were calibrated using unsaturated field stars with archival data from the Two Micron All Sky Survey (Skrutskie et al. 2006), yielding total magnitudes of J = 16.75 and Ks = 15.43 for the arc. The optical and infrared colours of each of the brighter arc segments S1-S3 are listed in Table 1.
3.3. Spectroscopy
In order to measure the redshift of PSZ1-ARC G311.6602−18.4624 and the cluster lens PSZ1 G311.65−18.48 we obtained a long-slit spectrum (spectral resolution R ≃ 700, slit width  ) using the IMACS instrument on the Magellan-I Baade Telescope with an exposure time of 2 × 750 s. The slit intersected the arc at the location of the knot with the highest R-band surface brightness (see Fig. 2), while simultaneously covering the BCG. Part of the resulting spectrum is shown in Fig. 3, spanning the range ~4000 Å−6500 Å. The spectrum of PSZ1-ARC G311.6602−18.4624 reveals Ly α emission and numerous other lines seen in emission or absorption in the rest-frame UV, such as Si II λλ 1259,1294 Å, C IV λλ 1548, 1550 Å; the spectrum also includes nebular semi-forbidden transitions of O III] λ 1666Å, Si III] λ1892 Å, and C III] λλ1907, 1909 Å. There is no significant observed flux bluewards of Ly α. The spectrum does not show any indications of broad emission lines associated with typical quasar activity.
The redshift of PSZ1-ARC G311.6602−18.4624 is z = 2.3686 ± 0.0006, determined from the nebular emission lines. The observed Ly α emission line is redshifted with respect to the nebular lines, yielding z = 2.3708 ± 0.0004. From the strength of the measured rest-frame equivalent width of Wr(Ly α) = −24 ± 8 Å, it can be properly classified as a Ly α emitter (LAE). By modelling the observed Ly α-line shape by radiative transfer through a dusty outflowing shell (Ahn 2004; Verhamme et al. 2006; Schaerer et al. 2011; Gronke et al. 2015) we obtain estimates for the intrinsic equivalent width of  , the outflow velocity
  , and neutral hydrogen column density
  . We note that the estimate of Wr,i(Ly α) was derived independently of the Wr(Ly α) measurement and has smaller fractional errors as a result of simultaneously fitting the line and surrounding continuum, while forcing the best-fit line profile shape to a particular physically motivated theoretical model. The observed spectrum is typical of active starbursts with strong outflows in the interstellar medium. As illustrated in Fig. 3, the spectral features are similar to those seen in composite spectra of z ~ 3 Lyman break galaxies (LBGs; Shapley et al. 2003). The spectrum shows strong asymmetric, redshifted Ly α emission and a mix of low-ionization (e.g. Si II) absorption lines from neutral outflowing gas and high-ionization features such as a strong P Cygni stellar wind profile of C IV, which is indicative of stellar winds from very young and massive stars. The observed C III] λλ1907, 1909 Å emission, Wr(C III] ) = −6 ± 4 Å, is also indicative of an intense burst of star formation that is coupled with low metallicity (Bayliss et al. 2014; Rigby et al. 2015).
The observed spectrum also covers the BCG, for which we see strong emission from the [O II] λλ 3727, 3729 Å doublet, in addition to typical absorption lines from early-type galaxies. These features yield a spectroscopic redshift z = 0.44316 ± 0.00035, which we adopt as the value of the cluster redshift.
4. Cluster mass estimates
4.1. SZ mass estimate
The size–flux degeneracy observed in Planck SZ data can be broken with the intersection of the M500– relation when the cluster redshift is known (Planck Collaboration XXIX 2014). The derived Y500 parameter is the SZ mass proxy that is equivalent to the X-ray mass proxy YX. Under the two hypotheses of cosmology and scaling relation (Planck Collaboration XX 2014), it provides the best estimate of Y500 for the Planck SZ clusters and conversely an estimate of the SZ-mass that is X-ray calibrated.
We use the 2D degeneracy plots measured from the Planck data in the direction of PSZ1 G311.65−18.48 and the measured redshift. We derive an SZ mass  , above the median mass, Mmed = 5.7 × 10¹⁴M⊙, of the newly discovered Planck clusters. We note that the M500SZ value, and its uncertainty, does not take into account the hydrostatic mass bias (Planck Collaboration XX 2014) and uncertainties in the value of this bias. The corresponding radius containing this mass is
  .
.
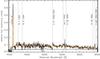 |
Fig. 3 Observed spectrum of PSZ1-ARC G311.6602−18.4624 (black solid curve). The dotted curve indicates the 1σ uncertainty of the spectrum. The most prominent absorption and emission lines, at a measured redshift of z = 2.369, are labelled on the figure and indicated with vertical dotted lines. Also plotted (orange curve) is a composite spectrum of ~1000 Lyman break galaxies at z ~ 3 from Shapley et al. (2003). |
4.2. Lensing mass estimate
The large azimuthal extent of the arc (108°) indicates a lens with a high degree of circular symmetry and a nearly perfect alignment of the cluster lens and PSZ1-ARC G311.6602− 18.4624 source galaxy along our line of sight. We derive a first estimate of the lensing mass by assuming a projected lens mass distribution that is circularly symmetric with an Einstein radius corresponding to the angular distance θarc between the BCG and the arc.
Hence, we estimate the Einstein radius  (the quoted uncertainty derived from the observed range in angular distance between the BCG and arc), corresponding to a physical radius in the lens plane of rE = 0.169 ± 0.025 Mpc. The estimated projected 2D mass within this radius is
  , where Σcrit = (c2/ 4πG)(Ds/DdDds) is the critical surface mass density and Ds, Dd, and Dds are angular diameter distances to the source, to the lens (deflector), and between the lens and source, respectively.
Comparing the strong lensing mass estimate to the SZ mass estimate quoted above requires a significant extrapolation by a factor of ~6 in radius. A crude estimate can still be made using the fact that at radii of ~0.1–1 Mpc in a massive cluster the drop in matter density with radius is close to the ρ(r) ∝ r-2 behaviour of an isothermal sphere; this yields a 3D mass estimate of M500 = 7 ± 2 × 10¹⁴M⊙, which is consistent with the SZ-based estimate. We caution, however, that numerical N-body simulations predict that the locations of tangential arcs such as PSZ1-ARC G311.6602−18.4624 show a wide scatter with respect to the true Einstein radii of clusters (Puchwein & Hilbert 2009). Deriving an accurate strong lensing mass for PSZ1 G311.65−18.48 will require detailed modelling of the cluster lens based on further spectroscopy and future high-resolution imaging of lensed sources behind the cluster.
5. Summary and discussion
In this letter, we presented the discovery of the strongly lensed arc PSZ1-ARC G311.6602−18.4624 and made an initial characterization of its photometric, morphological and spectroscopic properties. The arc corresponds to a highly magnified, vigorously star-forming LAE at z = 2.369 that is lensed by a foreground galaxy cluster at z = 0.443.
The observed properties of PSZ1-ARC G311.6602−18.4624 outlined above make it a highly interesting target for follow-up studies. Given the typical compact morphologies revealed by Hubble Space Telescope (HST) images of z ~ 2–3 LBGs (Giavalisco 1998), with half-light radii  , it is not surprising that the arc is unresolved in the radial direction in
  seeing. However, as such strongly lensed images are typically stretched by a factor close to unity in the radial direction; the fact that the arc has a length along its path of 55″ indicates a total lensing magnification factor of μ ≥ 50, which is extremely rare. On the other hand, even assuming magnifications as high as μ = 50 (100) yields an un-lensed, Galactic extinction corrected R-band (AB) magnitude of 22.0 (22.8), which is ≳1.5 mag brighter than L⋆ LBGs at this redshift (Bian et al. 2013). This would classify the galaxy as one of the intrinsically most ultraviolet luminous “normal” (i.e., non-AGN) galaxies known at z ~ 2–3. Such estimates are affected by the intrinsic ellipticity of the source galaxy: If the galaxy is intrinsically aligned with the direction of the shear, the magnification needed to account for the observed axis ratio would be smaller, but the intrinsic luminosity would be higher. If, on the other hand, it is aligned in the direction perpendicular to the shear direction, the magnification would be even higher. In any case, both the lensing magnification and intrinsic luminosity of PSZ1-ARC G311.6602−18.4624 are exceptional, and assuming more normal values for one only pushes the other towards even more extreme values.
Using the Galactic dust-corrected total AB magnitude of the arc and assuming a magnification factor of 50, following Sawicki & Thompson (2006) we converted the unlensed arc magnitude into an absolute magnitude at 1700 Å and, hence, a star formation rate (SFR) was found to be of order 100 M⊙ yr-1. This estimate would be an underestimate if there were significant dust extinction in the galaxy. If the magnification is higher than 50, then the actual SFR is lower.
Magnification factors μ > 50 imply that sub-100 parsec details in the source galaxy can be resolved by HST or using adaptive optics on 8-m class ground-based telescopes. Such high-resolution imaging will allow identification of multiply imaged, star-forming clumps along the arc, which can be used as input for detailed modelling of the mass distribution of the cluster lens and yield constraints on the local magnification in each point along the arc, aiding in the physical interpretation of the observed properties of the arc.
The measured redshift of the source also implies that a wide spectral range from Ly α to H α will be readily accessible for ground-based spectroscopy. The impressive amount of detail visible in the relatively shallow spectrum (with total exposure time of 25 min) shown in Fig. 3, covering only ~3% of its total length, gives an indication of the richness of information on the physical conditions obtainable from future multi-wavelength studies of this source, yielding detailed insights into the physical properties of its star formation activity and interstellar medium at an epoch when the universe was a quarter of its present age.
Based on observations collected at the European Organisation for Astronomical Research in the Southern Hemisphere under ESO programme 192.A-0762. This paper includes data gathered with the 6.5 m Magellan Telescopes located at Las Campanas Observatory, Chile.
Acknowledgments
Based on observations collected at the European Organisation for Astronomical Research in the Southern Hemisphere under ESO programme 192.A-0762. This paper includes data gathered with the 6.5 m Magellan telescopes located at Las Campanas Observatory, Chile. The development of Planck has been supported by: ESA; CNES and CNRS/INSU-IN2P3-INP (France); ASI, CNR, and INAF (Italy); NASA and DoE (USA); STFC and UKSA (UK); CSIC, MICINN, JA, and RES (Spain); Tekes, AoF, and CSC (Finland); DLR and MPG (Germany); CSA (Canada); DTU Space (Denmark); SER/SSO (Switzerland); RCN (Norway); SFI (Ireland); FCT/MCTES (Portugal); and PRACE (EU). H.D. acknowledges support from the Research Council of Norway. The authors acknowledge support from the CNRS-INSU “Programme National de Cosmologie et Galaxies” and the use of the TERAPIX facility for the data reduction. E.P. acknowledges the support of the French Agence Nationale de la Recherche under grant ANR-11-BS56-015. R.B. and R.S. acknowledge support from Russian Science Foundation grant RNF-14-22-00271. This publication makes use of data products from the Two Micron All Sky Survey. This research made use of the SZ-cluster (http://szcluster-db.ias.u-psud.fr/) database operated by IDOC at IAS Orsay, France; NASA/IPAC Extragalactic Database (NED) and the SIMBAD database, operated at CDS, Strasbourg, France.
References
- Ahn, S.-H. 2004, ApJ, 601, L25 [NASA ADS] [CrossRef] [Google Scholar]
- Allam, S. S., Tucker, D. L., Lin, H., et al. 2007, ApJ, 662, L51 [NASA ADS] [CrossRef] [Google Scholar]
- Bayliss, M. B., Gladders, M. D., Oguri, M., et al. 2011, ApJ, 727, L26 [NASA ADS] [CrossRef] [Google Scholar]
- Bayliss, M. B., Rigby, J. R., Sharon, K., et al. 2014, ApJ, 790, 144 [NASA ADS] [CrossRef] [Google Scholar]
- Belokurov, V., Evans, N. W., Moiseev, A., et al. 2007, ApJ, 671, L9 [NASA ADS] [CrossRef] [Google Scholar]
- Bertin, E., & Arnouts, S. 1996, A&AS, 117, 393 [NASA ADS] [CrossRef] [EDP Sciences] [Google Scholar]
- Bian, F., Fan, X., Jiang, L., et al. 2013, ApJ, 774, 28 [NASA ADS] [CrossRef] [Google Scholar]
- Giavalisco, M. 1998, in The Hubble Deep Field, Proc. Space Telescope Science Institute Symp., eds. M. Livio, et al., 121 [Google Scholar]
- Gladders, M. D., & Yee, H. K. C. 2000, AJ, 120, 2148 [NASA ADS] [CrossRef] [Google Scholar]
- Gronke, M., Bull, P., & Dijkstra, M. 2015, ApJ, 812, 123 [NASA ADS] [CrossRef] [Google Scholar]
- Hammer, F., Rigaut, F., Le Fevre, O., Jones, J., & Soucail, G. 1989, A&A, 208, L7 [NASA ADS] [Google Scholar]
- Koester, B. P., Gladders, M. D., Hennawi, J. F., et al. 2010, ApJ, 723, L73 [NASA ADS] [CrossRef] [Google Scholar]
- Lynds, R., & Petrosian, V. 1989, ApJ, 336, 1 [NASA ADS] [CrossRef] [Google Scholar]
- Monet, D. G., Levine, S. E., Canzian, B., et al. 2003, AJ, 125, 984 [NASA ADS] [CrossRef] [Google Scholar]
- Planck Collaboration VIII. 2011, A&A, 536, A8 [NASA ADS] [CrossRef] [EDP Sciences] [Google Scholar]
- Planck Collaboration XX. 2014, A&A, 571, A20 [NASA ADS] [CrossRef] [EDP Sciences] [Google Scholar]
- Planck Collaboration XXIX. 2014, A&A, 571, A29 [NASA ADS] [CrossRef] [EDP Sciences] [Google Scholar]
- Planck Collaboration Int. XXVI. 2015, A&A, 582, A29 [NASA ADS] [CrossRef] [EDP Sciences] [Google Scholar]
- Planck Collaboration Int. XXXVI. 2016, A&A, 586, A139 [NASA ADS] [CrossRef] [EDP Sciences] [Google Scholar]
- Planck Collaboration XXVII. 2015, A&A, in press, DOI: 10.1051/0004-6361/201525823 [Google Scholar]
- Puchwein, E., & Hilbert, S. 2009, MNRAS, 398, 1298 [NASA ADS] [CrossRef] [Google Scholar]
- Rigby, J. R., Bayliss, M. B., Gladders, M. D., et al. 2015, ApJ, 814, L6 [NASA ADS] [CrossRef] [Google Scholar]
- Sawicki, M., & Thompson, D. 2006, ApJ, 642, 653 [NASA ADS] [CrossRef] [Google Scholar]
- Schaerer, D., Hayes, M., Verhamme, A., & Teyssier, R. 2011, A&A, 531, A12 [NASA ADS] [CrossRef] [EDP Sciences] [Google Scholar]
- Schlafly, E. F., & Finkbeiner, D. P. 2011, ApJ, 737, 103 [NASA ADS] [CrossRef] [Google Scholar]
- Shapley, A. E., Steidel, C. C., Pettini, M., & Adelberger, K. L. 2003, ApJ, 588, 65 [NASA ADS] [CrossRef] [Google Scholar]
- Skrutskie, M. F., Cutri, R. M., Stiening, R., et al. 2006, AJ, 131, 1163 [NASA ADS] [CrossRef] [Google Scholar]
- Smail, I., Swinbank, A. M., Richard, J., et al. 2007, ApJ, 654, L33 [NASA ADS] [CrossRef] [Google Scholar]
- Soucail, G., Fort, B., Mellier, Y., & Picat, J. P. 1987, A&A, 172, L14 [NASA ADS] [Google Scholar]
- Sunyaev, R. A., & Zel’dovich, Y. B. 1972, Comments on Astrophysics and Space Physics, 4, 173 [Google Scholar]
- van der Burg, R. F. J., Aussel, H., Pratt, G. W., et al. 2016, A&A, 587, A23 [NASA ADS] [CrossRef] [EDP Sciences] [Google Scholar]
- Verhamme, A., Schaerer, D., & Maselli, A. 2006, A&A, 460, 397 [NASA ADS] [CrossRef] [EDP Sciences] [Google Scholar]
- Voges, W., Aschenbach, B., Boller, Th., et al. 2000, IAU Circ., 7432, 3 [NASA ADS] [Google Scholar]
- Wuyts, E., Barrientos, L. F., Gladders, M. D., et al. 2010, ApJ, 724, 1182 [NASA ADS] [CrossRef] [Google Scholar]
- Yee, H. K. C., Ellingson, E., Bechtold, J., Carlberg, R. G., & Cuillandre, J.-C. 1996, AJ, 111, 1783 [NASA ADS] [CrossRef] [Google Scholar]
All Tables
Astrometric and photometric properties of the three bright segments of PSZ1-ARC G311.6602−18.4624.
All Figures
|
Fig. 1 Colour image of the cluster lens and arc, generated from the NTT/EFOCS2 R-and z-band images. The locations of the BCG and arc segments S1-S3 are indicated; the location of a candidate arc at the opposite side of the BCG and the positions of the Planck SZ source and the X-ray source from the RASS Faint Source Catalogue are shown. |
| In the text | |
|
Fig. 2 Top row: NTT/EFOSC2 R- (left) and z-band close-up images of PSZ1-ARC G311.6602−18.4624. Bottom row: Magellan/FourStar J- and Ks-band images covering the same area. The dotted lines in the upper left panel indicate the slit position used for the spectroscopic observations described in Sect. 3.3. |
| In the text | |
|
Fig. 3 Observed spectrum of PSZ1-ARC G311.6602−18.4624 (black solid curve). The dotted curve indicates the 1σ uncertainty of the spectrum. The most prominent absorption and emission lines, at a measured redshift of z = 2.369, are labelled on the figure and indicated with vertical dotted lines. Also plotted (orange curve) is a composite spectrum of ~1000 Lyman break galaxies at z ~ 3 from Shapley et al. (2003). |
| In the text | |
Current usage metrics show cumulative count of Article Views (full-text article views including HTML views, PDF and ePub downloads, according to the available data) and Abstracts Views on Vision4Press platform.
Data correspond to usage on the plateform after 2015. The current usage metrics is available 48-96 hours after online publication and is updated daily on week days.
Initial download of the metrics may take a while.