Fig. 3
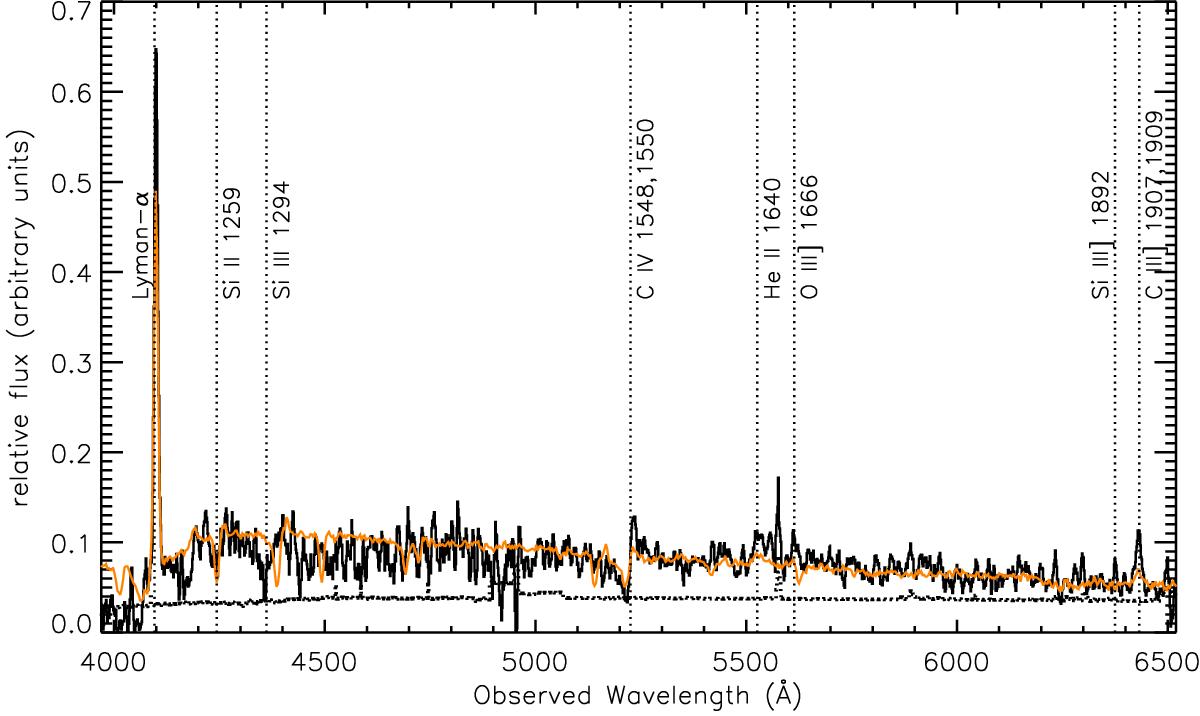
Observed spectrum of PSZ1-ARC G311.6602−18.4624 (black solid curve). The dotted curve indicates the 1σ uncertainty of the spectrum. The most prominent absorption and emission lines, at a measured redshift of z = 2.369, are labelled on the figure and indicated with vertical dotted lines. Also plotted (orange curve) is a composite spectrum of ~1000 Lyman break galaxies at z ~ 3 from Shapley et al. (2003).
Current usage metrics show cumulative count of Article Views (full-text article views including HTML views, PDF and ePub downloads, according to the available data) and Abstracts Views on Vision4Press platform.
Data correspond to usage on the plateform after 2015. The current usage metrics is available 48-96 hours after online publication and is updated daily on week days.
Initial download of the metrics may take a while.