Free Access
Fig. 2
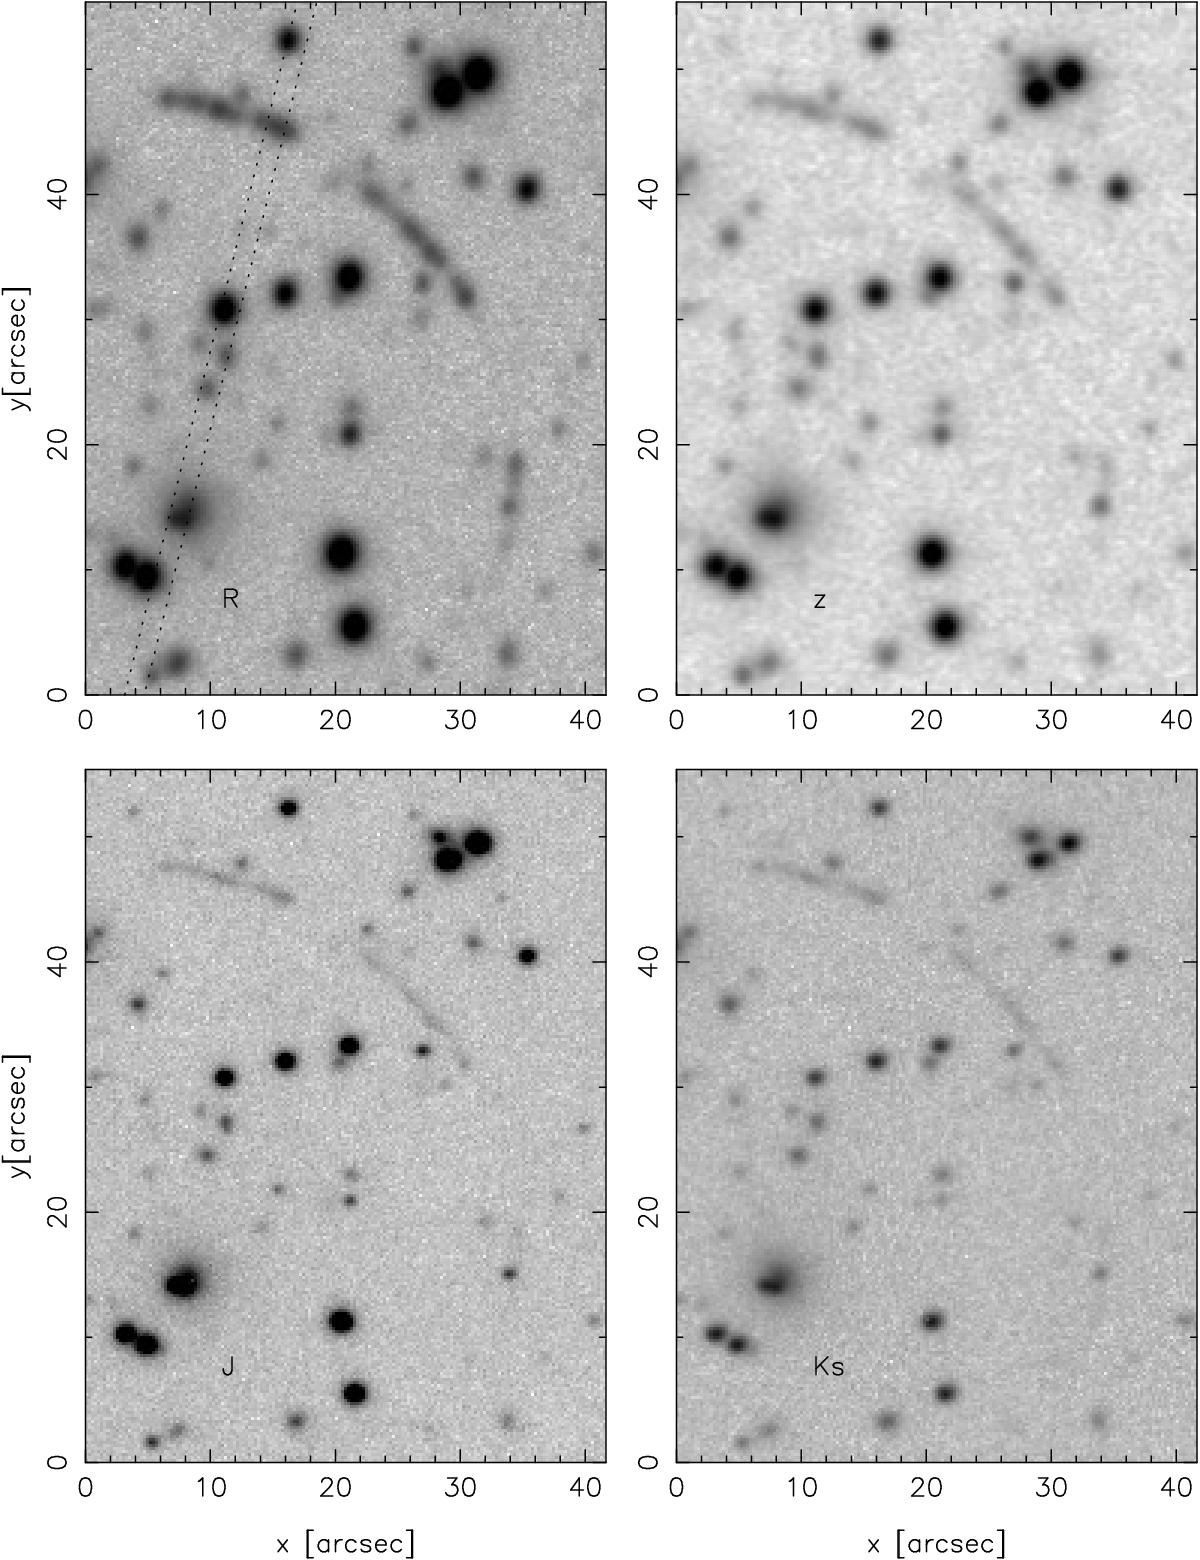
Top row: NTT/EFOSC2 R- (left) and z-band close-up images of PSZ1-ARC G311.6602−18.4624. Bottom row: Magellan/FourStar J- and Ks-band images covering the same area. The dotted lines in the upper left panel indicate the slit position used for the spectroscopic observations described in Sect. 3.3.
Current usage metrics show cumulative count of Article Views (full-text article views including HTML views, PDF and ePub downloads, according to the available data) and Abstracts Views on Vision4Press platform.
Data correspond to usage on the plateform after 2015. The current usage metrics is available 48-96 hours after online publication and is updated daily on week days.
Initial download of the metrics may take a while.