Fig. 1
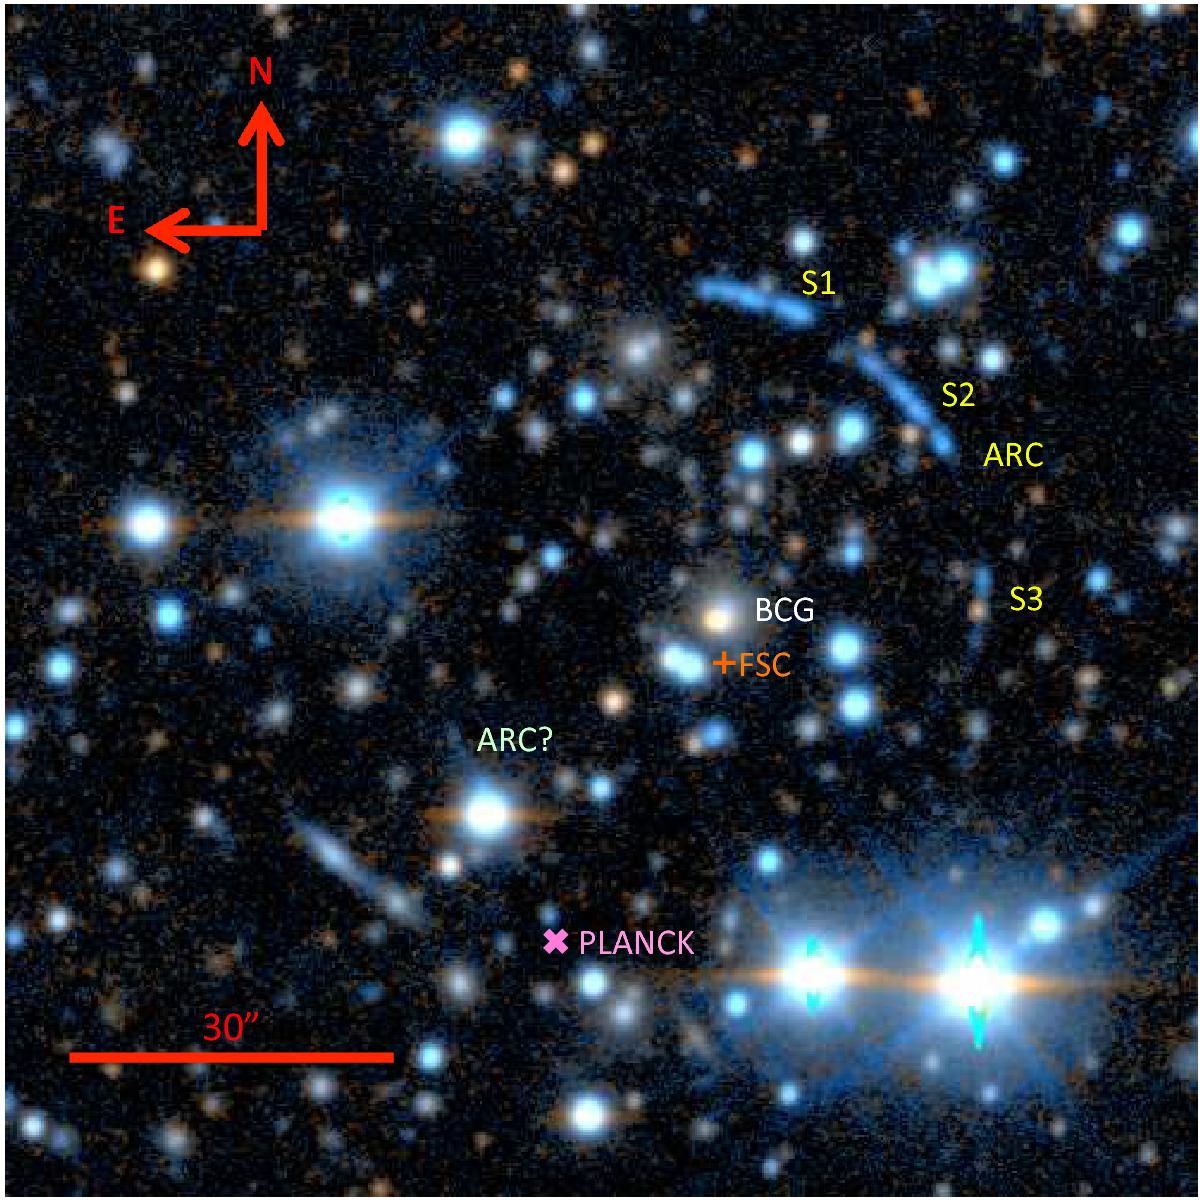
Colour image of the cluster lens and arc, generated from the NTT/EFOCS2 R-and z-band images. The locations of the BCG and arc segments S1-S3 are indicated; the location of a candidate arc at the opposite side of the BCG and the positions of the Planck SZ source and the X-ray source from the RASS Faint Source Catalogue are shown.
Current usage metrics show cumulative count of Article Views (full-text article views including HTML views, PDF and ePub downloads, according to the available data) and Abstracts Views on Vision4Press platform.
Data correspond to usage on the plateform after 2015. The current usage metrics is available 48-96 hours after online publication and is updated daily on week days.
Initial download of the metrics may take a while.