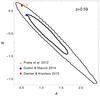
Fig. 9
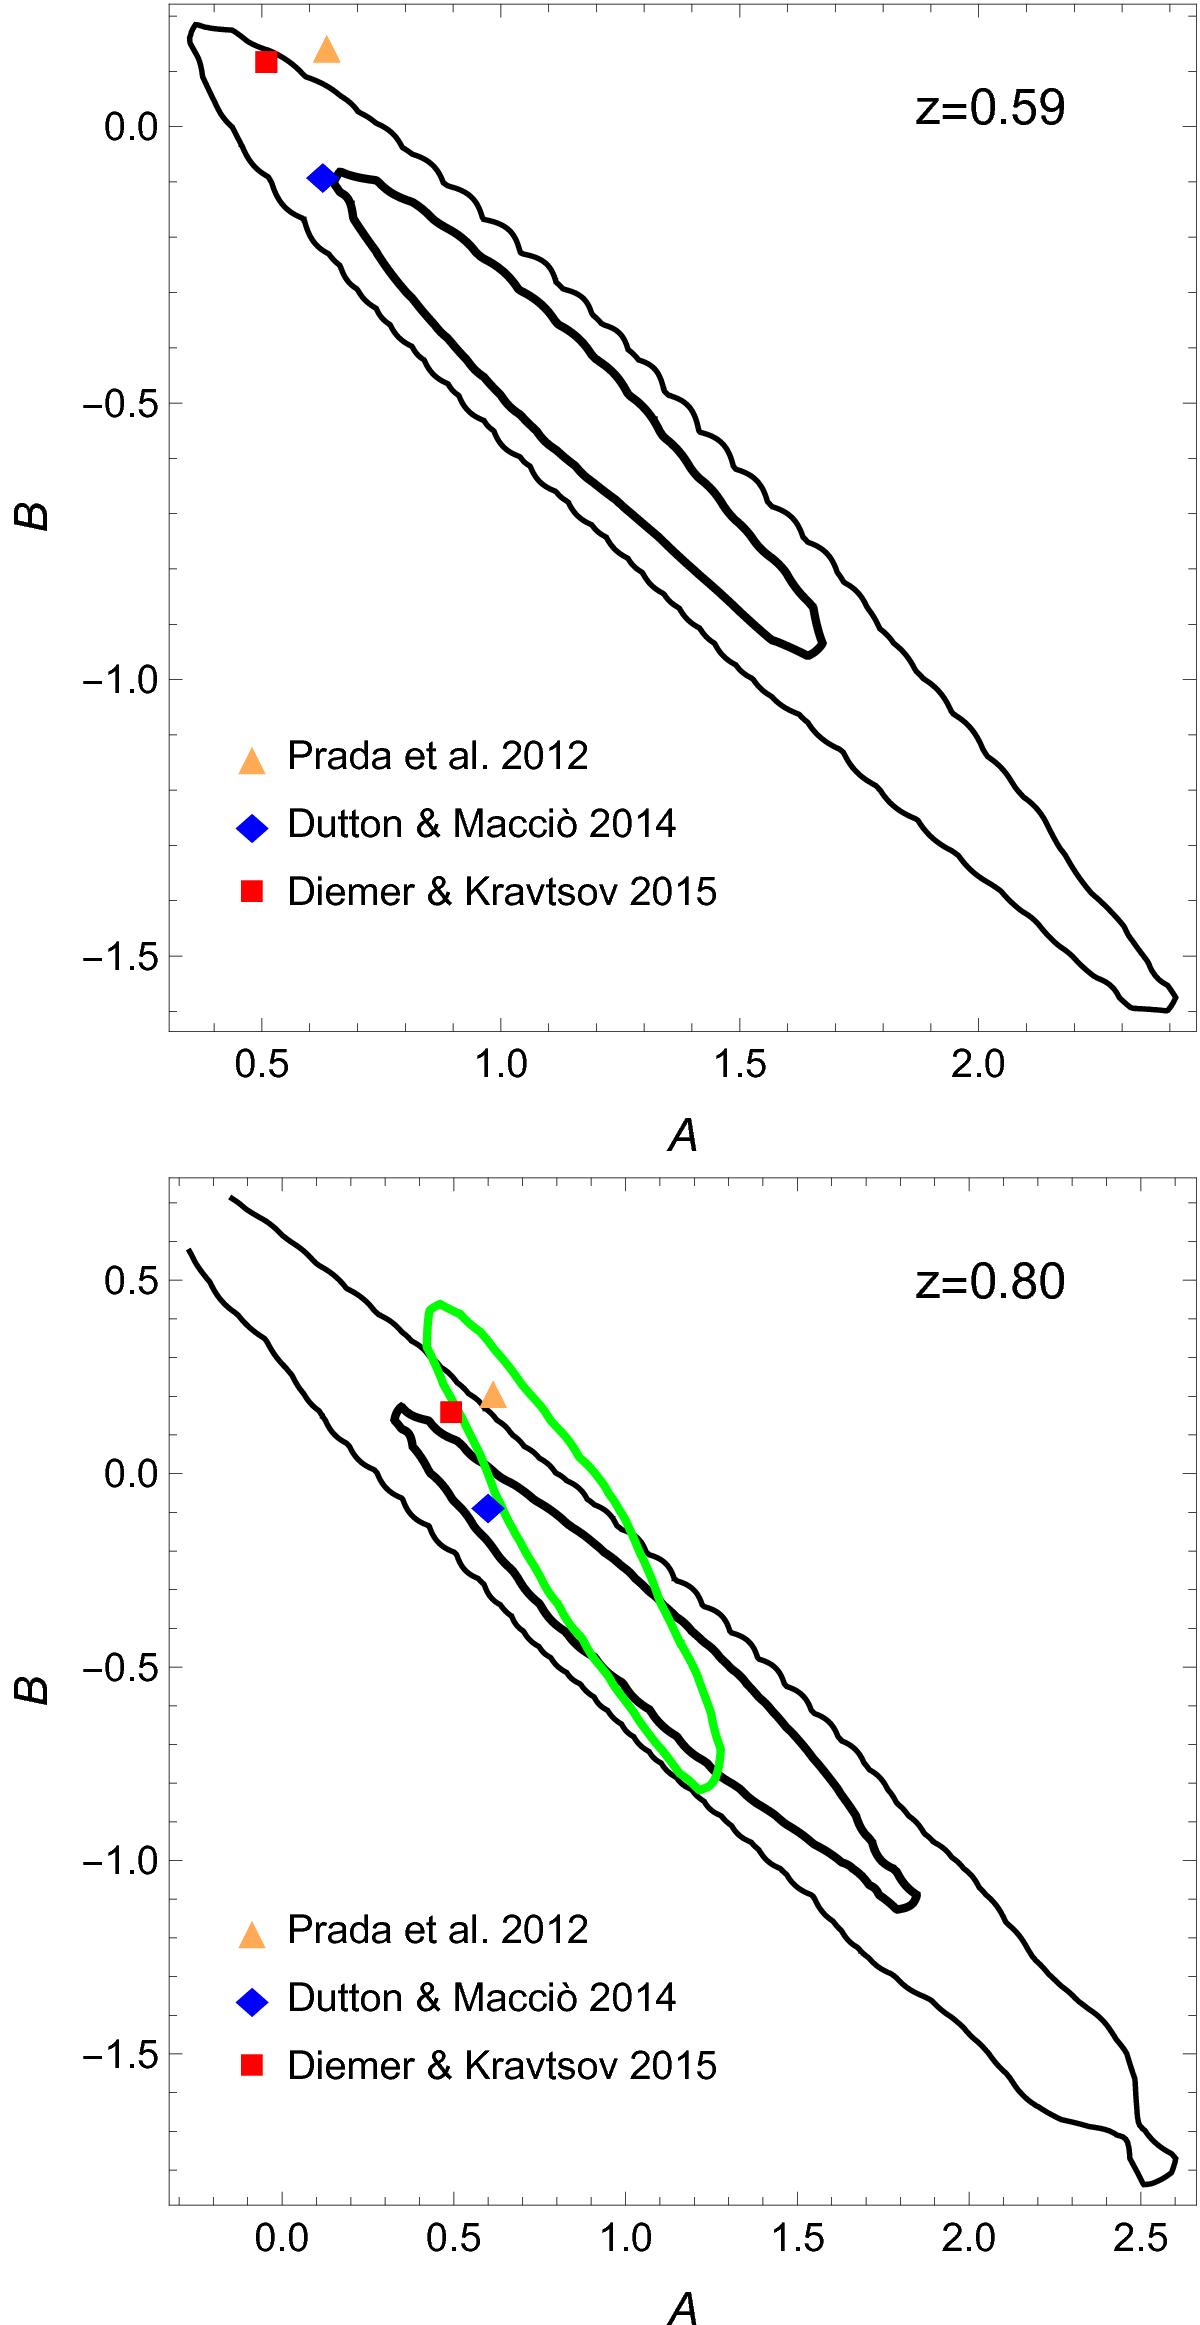
Probability distributions of the A and B parameters of the c − M relation Eq. (9) calculated with LIRA, for the full sample (top) and for the subsample of clusters at z ≥ 0.7 (bottom). The relations are normalised at the median redshift of the sample considered (0.59 and 0.80, respectively). The confidence regions are defined as in Fig. 7. The coloured symbols show the estimates of the parameters from simulations by P12, DM14, and DK15 evaluated at the quoted redshift. The green contour shows the constraints from Sereno & Covone (2013) at 1σ.
Current usage metrics show cumulative count of Article Views (full-text article views including HTML views, PDF and ePub downloads, according to the available data) and Abstracts Views on Vision4Press platform.
Data correspond to usage on the plateform after 2015. The current usage metrics is available 48-96 hours after online publication and is updated daily on week days.
Initial download of the metrics may take a while.