Fig. 8
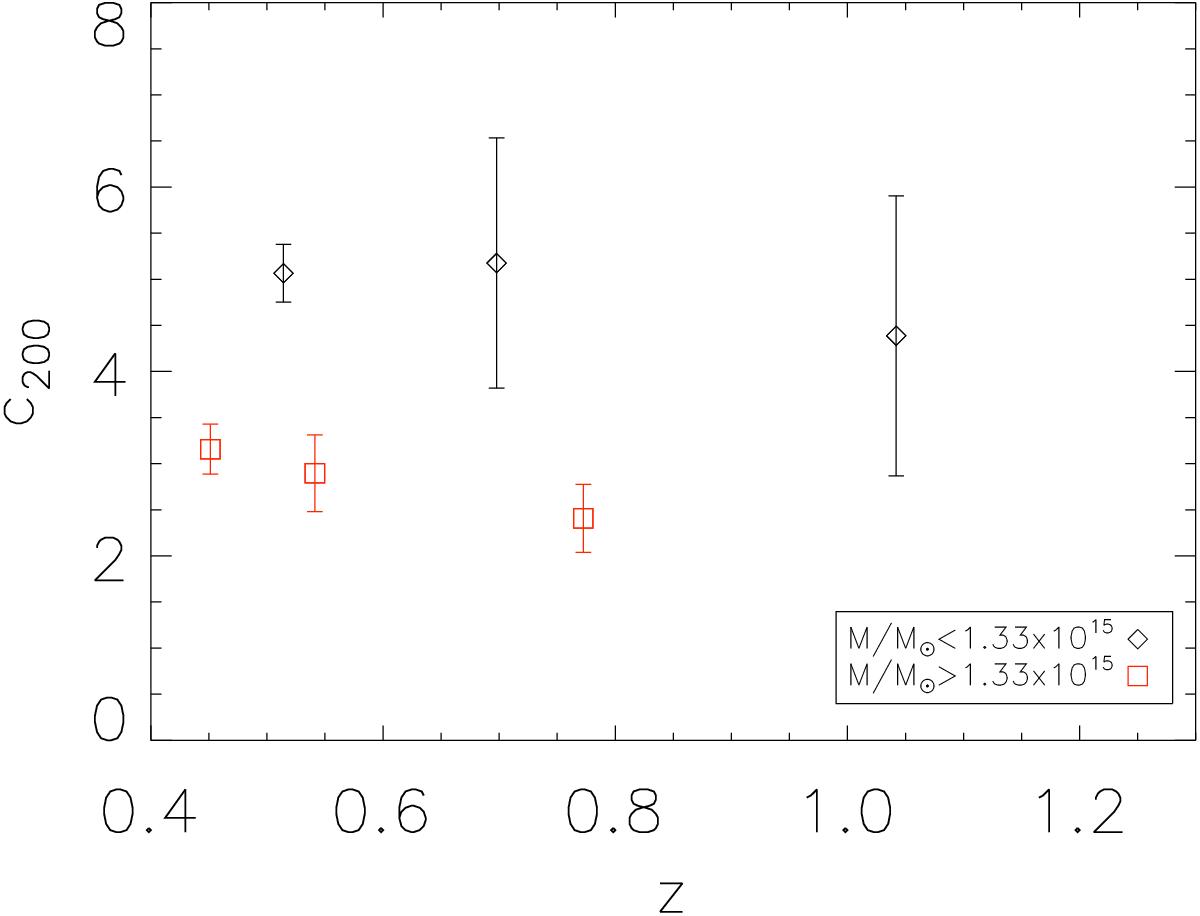
Concentration-redshift relation calculated in two mass ranges: M ≤ 1.33 × 10¹⁵M⊙ (black) and M< 1.33 × 10¹⁵M⊙ (red). For each mass range, the points are the error-weighted means of the concentrations and the error bars are the errors on the means for three redshift bins. The sample is approximately evenly divided in each bin and we show the median redshift for simplicity.
Current usage metrics show cumulative count of Article Views (full-text article views including HTML views, PDF and ePub downloads, according to the available data) and Abstracts Views on Vision4Press platform.
Data correspond to usage on the plateform after 2015. The current usage metrics is available 48-96 hours after online publication and is updated daily on week days.
Initial download of the metrics may take a while.