Fig. 7
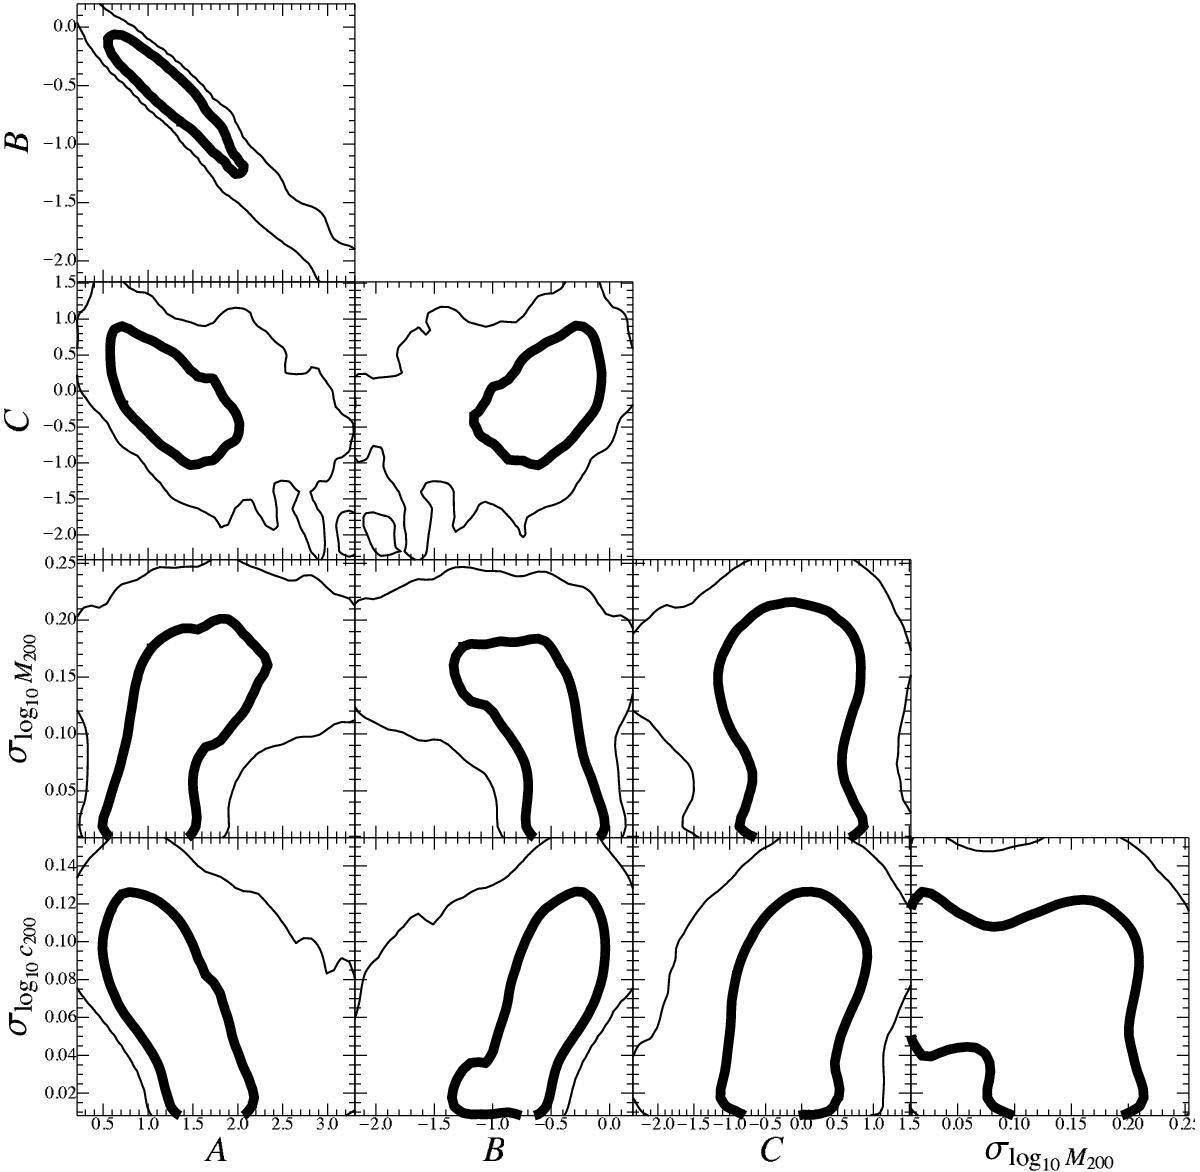
Probability distributions of the best-fit parameters of the c − M − z relation Eq. (9) obtained with LIRA, where the covariance between mass and concentration is taken into account. The thick (thin) lines include the 1-(2-)σ confidence region in two dimensions, here defined as the region within which the value of the probability is larger than exp [ −2.3/2 ] (exp [ −6.17/2 ]) of the maximum.
Current usage metrics show cumulative count of Article Views (full-text article views including HTML views, PDF and ePub downloads, according to the available data) and Abstracts Views on Vision4Press platform.
Data correspond to usage on the plateform after 2015. The current usage metrics is available 48-96 hours after online publication and is updated daily on week days.
Initial download of the metrics may take a while.