Fig. 5
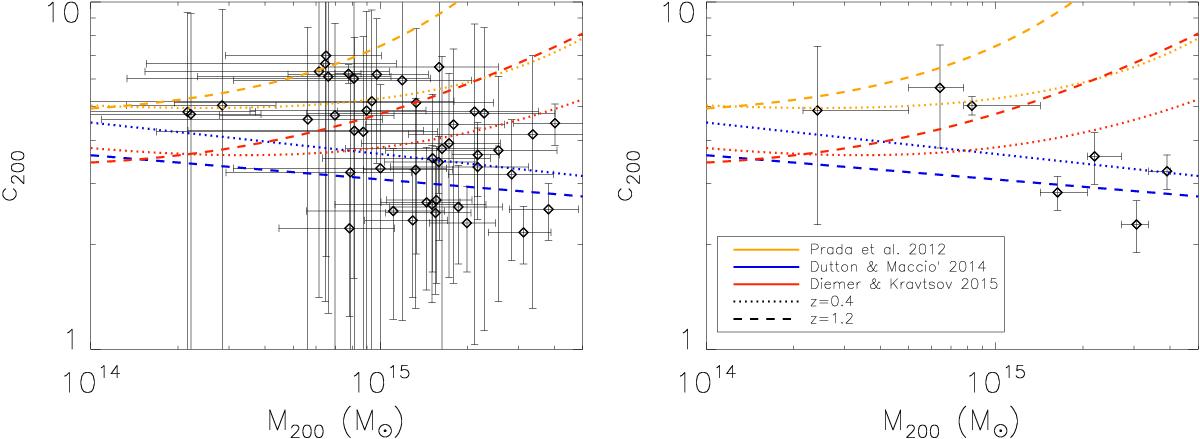
Left: concentration–mass relation obtained for the final cluster sample in the case Δ = 200 (black diamonds). The cluster total masses are obtained following the backwards method described in Ettori et al. (2002). A NFW profile is adopted to describe the gravitational potential. We overplot the c200 − M200 relations predicted by P12 (yellow lines), DM14 (blue lines), and DK15 (red lines). They are calculated for z = 0.4 (dotted lines) and z = 1.2 (dashed lines), which are the lowest and highest redshifts in the sample. Right: the same as the left panel, but here the sample is divided into 7 mass bins. For each bin, error-weighted means for concentration and mass are calculated (black diamonds) and the error bars represent the errors on the weighted means.
Current usage metrics show cumulative count of Article Views (full-text article views including HTML views, PDF and ePub downloads, according to the available data) and Abstracts Views on Vision4Press platform.
Data correspond to usage on the plateform after 2015. The current usage metrics is available 48-96 hours after online publication and is updated daily on week days.
Initial download of the metrics may take a while.