Free Access
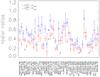
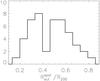
Fig. 2
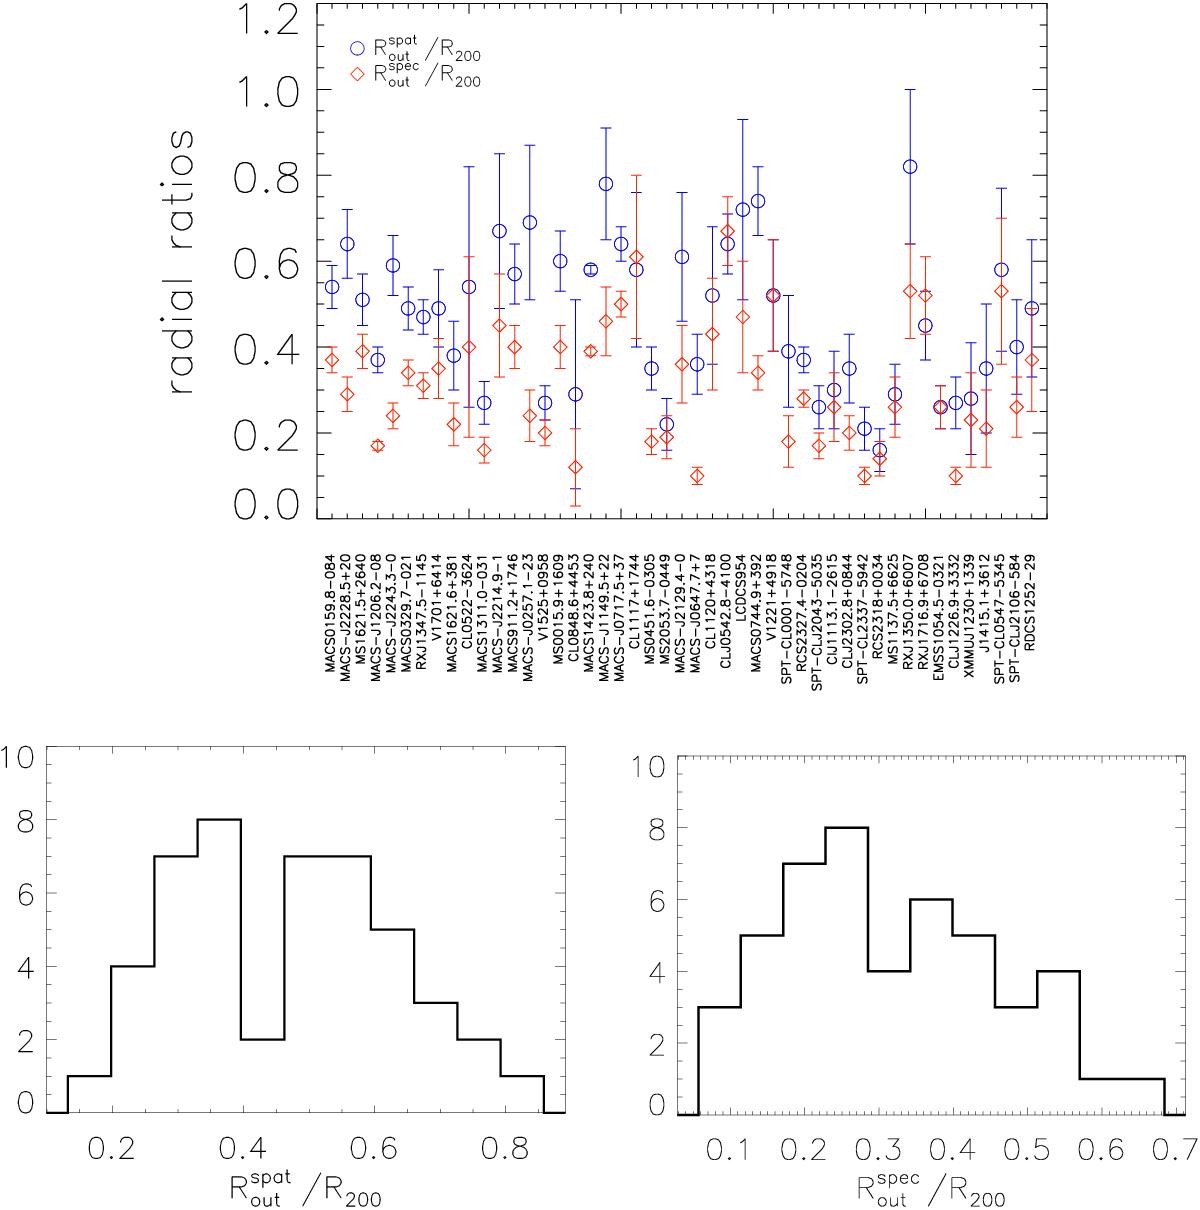
Top: for each cluster in the final sample, we show: the ratio between the upper limit of the radial range investigated in the spatial analysis and our estimate of R200 (blue circles); the ratio between the maximum radial extension of the spectral analysis and R200 (red diamonds). Bottom: distributions of the radial ratios.
This figure is made of several images, please see below:
Current usage metrics show cumulative count of Article Views (full-text article views including HTML views, PDF and ePub downloads, according to the available data) and Abstracts Views on Vision4Press platform.
Data correspond to usage on the plateform after 2015. The current usage metrics is available 48-96 hours after online publication and is updated daily on week days.
Initial download of the metrics may take a while.