Fig. 13
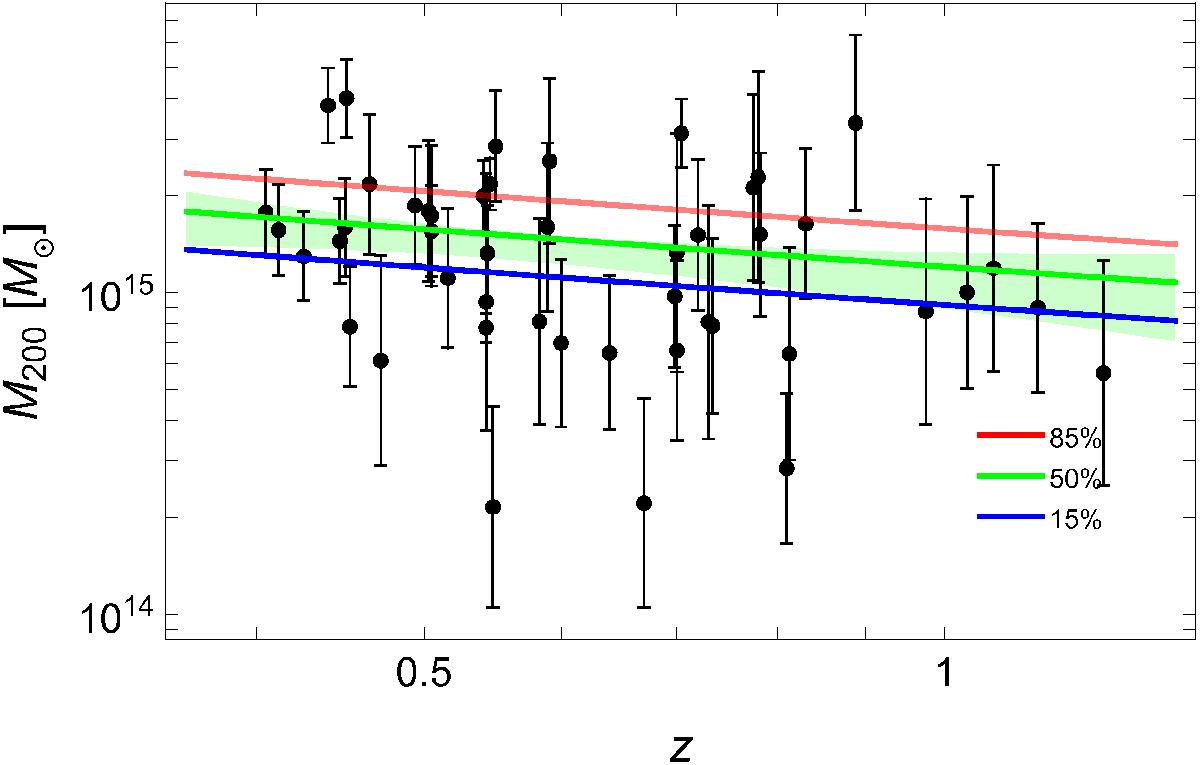
Completeness functions compared to the distribution of the selected clusters in the M200 − z plane (black points). The full lines plot the true value of mass (see text and Appendix A in Sereno & Ettori 2015b for details) below which a given fraction (from top to bottom: 85, 50, and 15 per cent levels, respectively) of the selected sample is contained. The shaded green region encloses the 68.3 per cent confidence region around the 50 per cent level due to uncertainties on the parameters.
Current usage metrics show cumulative count of Article Views (full-text article views including HTML views, PDF and ePub downloads, according to the available data) and Abstracts Views on Vision4Press platform.
Data correspond to usage on the plateform after 2015. The current usage metrics is available 48-96 hours after online publication and is updated daily on week days.
Initial download of the metrics may take a while.