Fig. 12
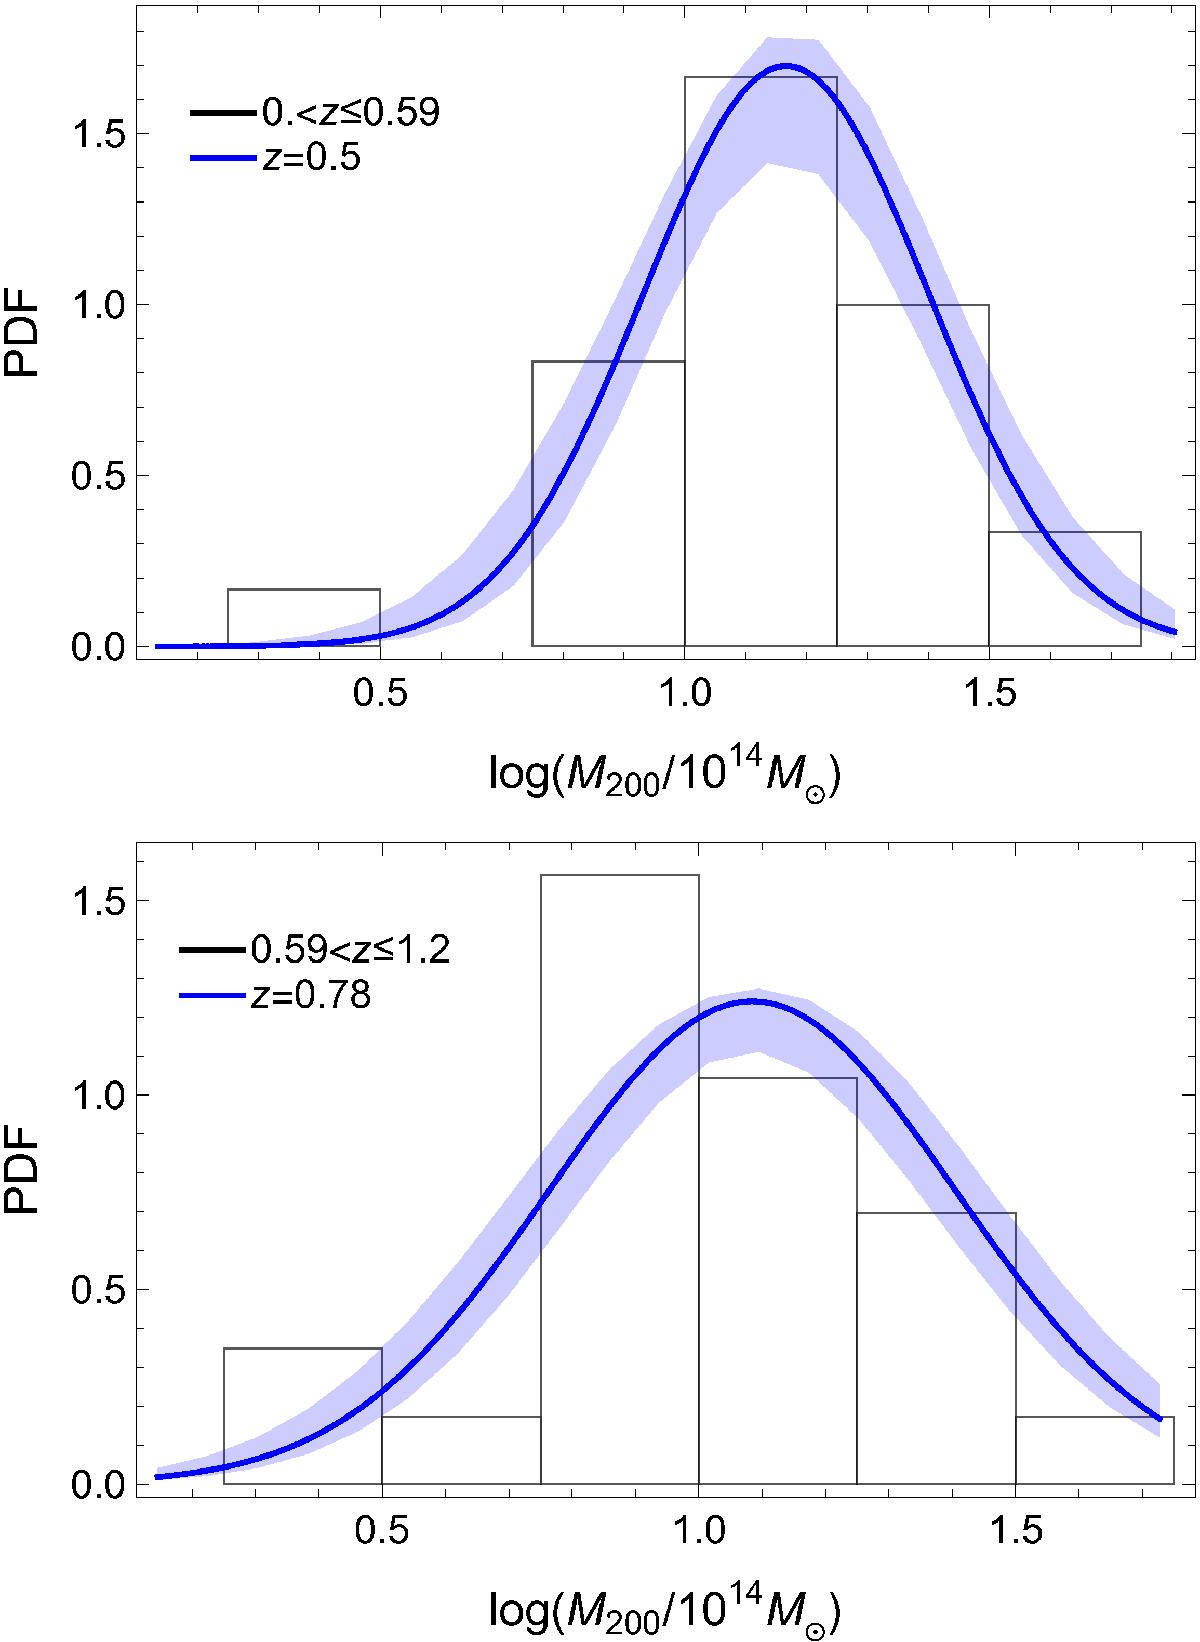
Mass distribution of the selected clusters in two redshift bins. The black histogram bins the observed masses. The blue line is the normal approximation estimated from the regression at the median redshift (see text for details). The shaded blue region encloses the 68.3 per cent probability region around the median relation due to parameter uncertainties. Redshift increases from top to bottom panel. The median and boundaries of the redshift bins are indicated in the legends of the respective panels.
Current usage metrics show cumulative count of Article Views (full-text article views including HTML views, PDF and ePub downloads, according to the available data) and Abstracts Views on Vision4Press platform.
Data correspond to usage on the plateform after 2015. The current usage metrics is available 48-96 hours after online publication and is updated daily on week days.
Initial download of the metrics may take a while.