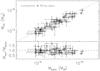
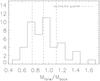
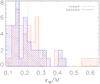
Fig. 1
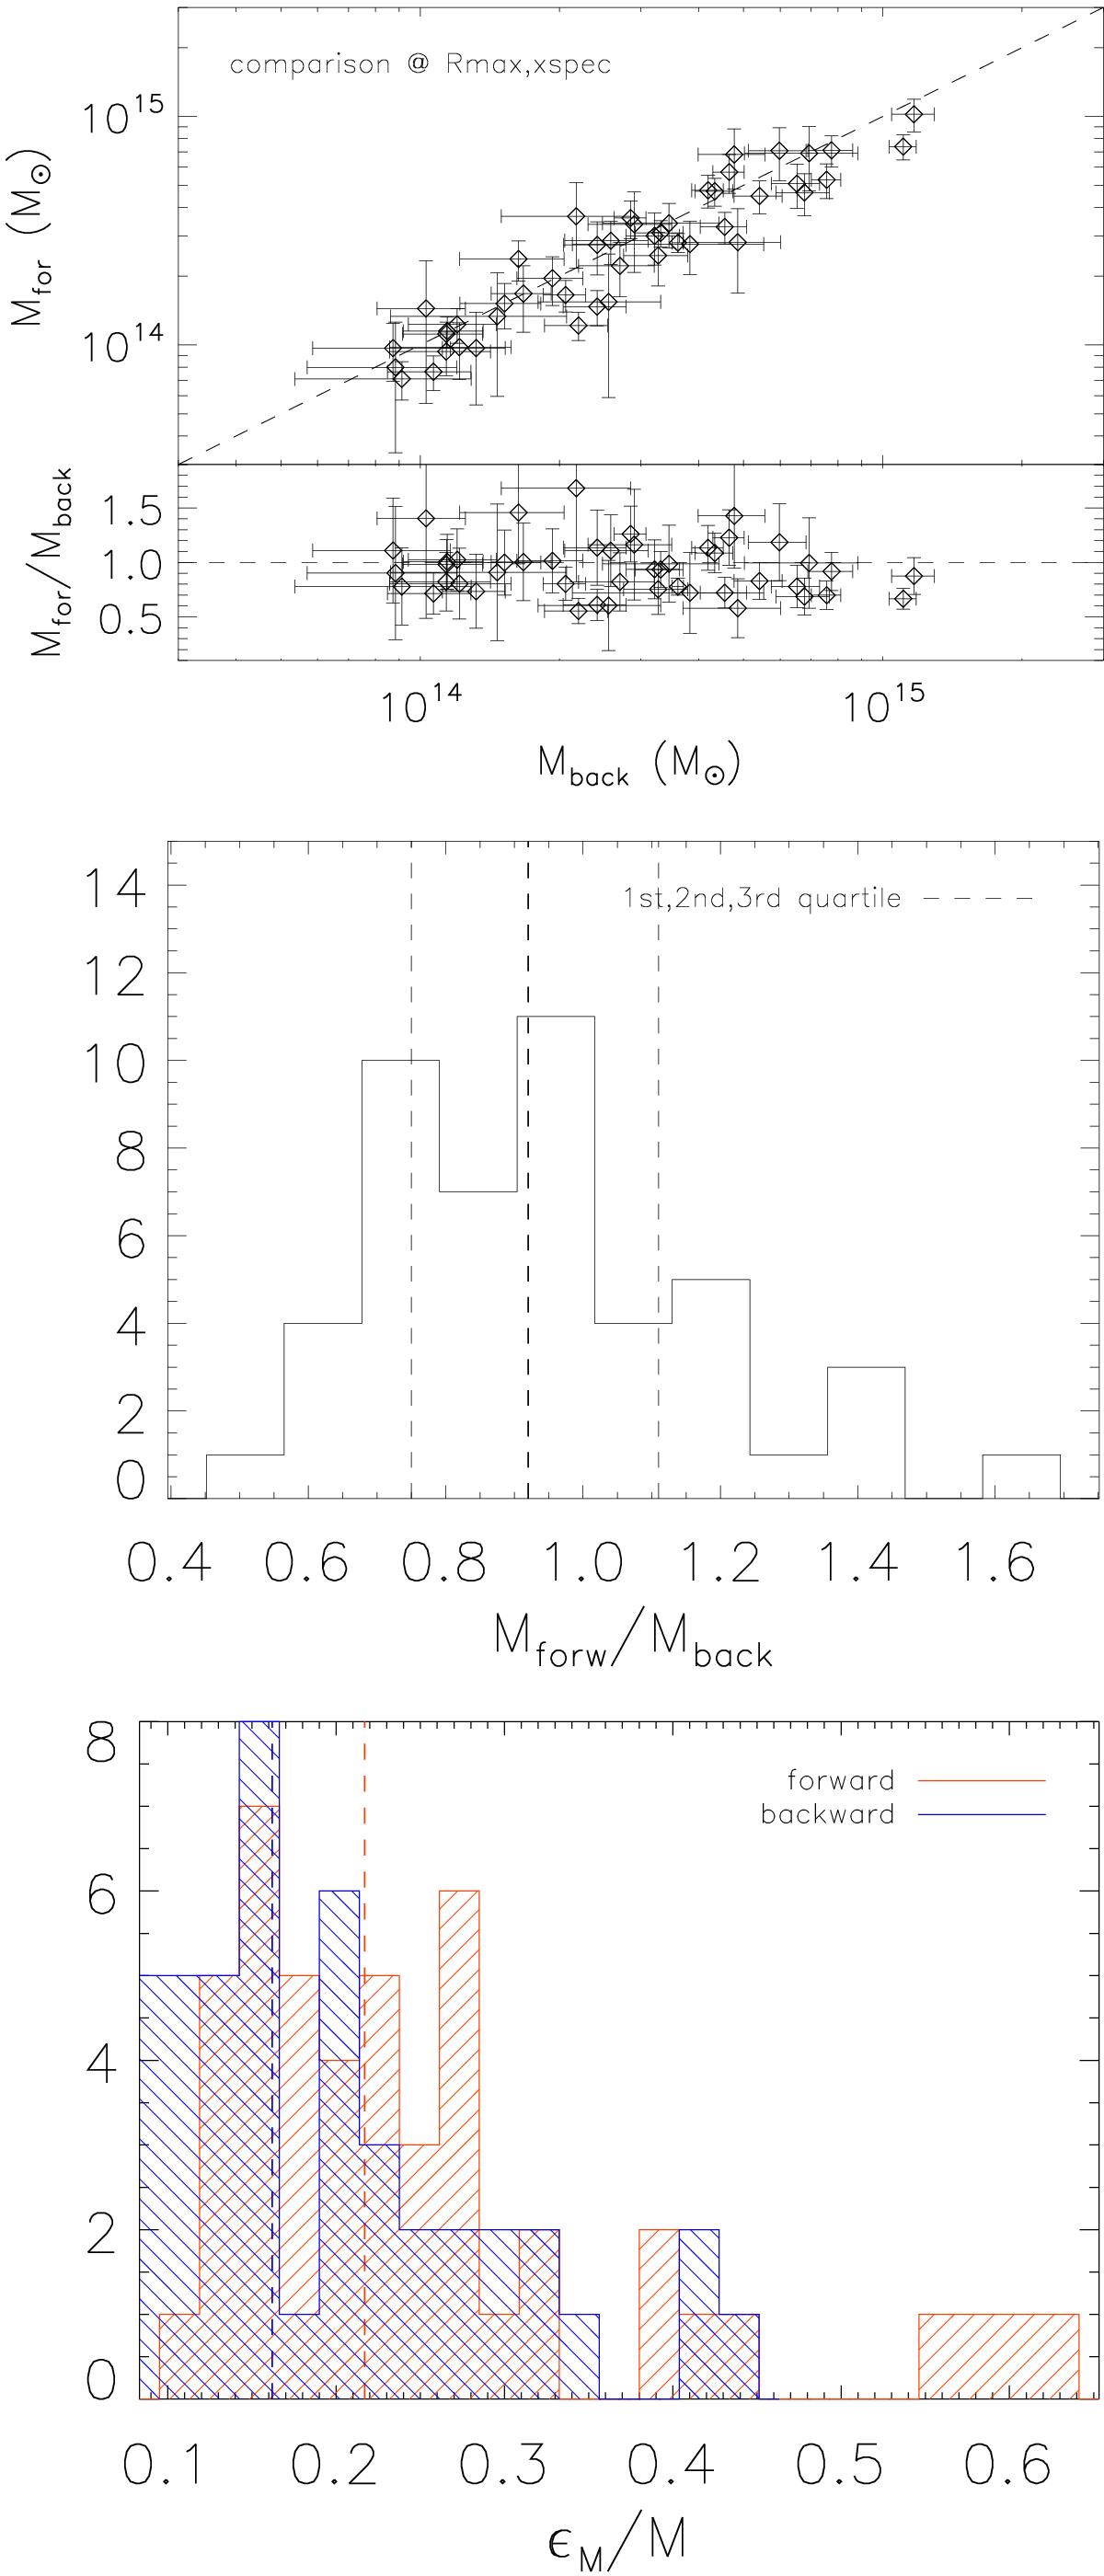
Top: comparison between mass estimates obtained following the forwards method (Mfor) and backwards method (Mback) for the 47 clusters of our sample. The lower panel shows the Mfor/Mback ratio of individual clusters against Mback. The dashed line shows the one-to-one relation. The comparison is made at the outermost radius measured in the spectral analysis for each cluster. Middle: distribution of the mass ratios. Bottom: distribution of the relative errors.
Current usage metrics show cumulative count of Article Views (full-text article views including HTML views, PDF and ePub downloads, according to the available data) and Abstracts Views on Vision4Press platform.
Data correspond to usage on the plateform after 2015. The current usage metrics is available 48-96 hours after online publication and is updated daily on week days.
Initial download of the metrics may take a while.