Fig. 9
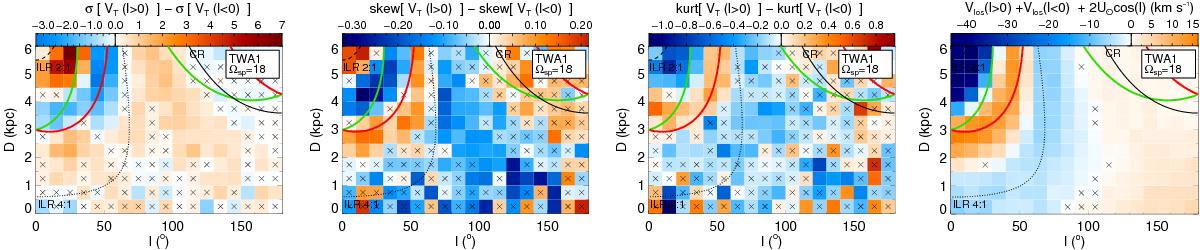
Difference between several kinematic quantities in symmetric bins (l, d) and (−l, d) for model TWA1. The first three plots show the transverse velocity dispersion σ(VT), skewness, and kurtosis of the transverse velocity distribution. The last plot shows the difference between the los velocity Vlos compared to the expected value −2U⊙cosl. We plot a black cross in bins where these quantities are statistically consistent with 0 with a 75% confidence, i.e. where they are compatible with an axisymmetric model. The rest of the notation is as in Fig. 6.

Current usage metrics show cumulative count of Article Views (full-text article views including HTML views, PDF and ePub downloads, according to the available data) and Abstracts Views on Vision4Press platform.
Data correspond to usage on the plateform after 2015. The current usage metrics is available 48-96 hours after online publication and is updated daily on week days.
Initial download of the metrics may take a while.