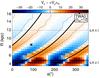
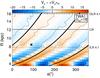
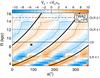
Fig. 3
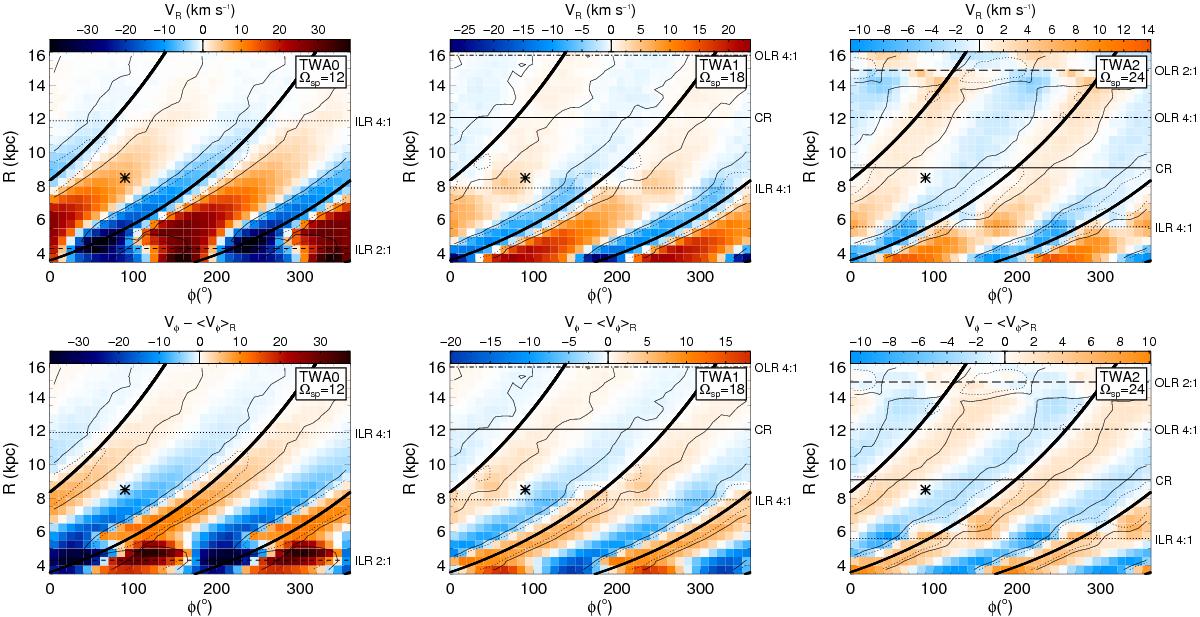
Galactocentric radial VR (top) and azimuthal Vφ (bottom) velocities as a function of cylindrical coordinates for models TWA0, TWA1, and TWA2 (left, middle, and right). Colours show the median velocity in bins in cylindrical coordinates of size ΔR = 0.5 kpc and Δφ = 10°. For Vφ we plot Vφ − ⟨ Vφ ⟩ R where ⟨ Vφ ⟩ R is the average median over all bins at the same radius R, that is we subtract the average rotation velocity at each radius. To make the comparison easier, the colour scale is the same for all panels but the scale indicated above each panel shows only the range for that particular model. The theoretical locus of the arms is shown as a thick black line. The solid and dotted curves indicate the over-density of the spiral arms where the density contrast (N − ⟨ N ⟩ R) / ⟨ N ⟩ R is 0 and 0.2 of the maximum value, respectively, where N is the number of particles in each pixel of the grid and ⟨ N ⟩ R is the azimuthal average. The locations of the main resonances CR, ILR 2:1, ILR 4:1, OLR 4:1, OLR 2:1 are shown with black horizontal lines (solid, dashed, dotted, dashed-dotted, and long-dashed, respectively). The rotation of the Galaxy is towards the left. The black asterisk shows the location of the Sun.
Current usage metrics show cumulative count of Article Views (full-text article views including HTML views, PDF and ePub downloads, according to the available data) and Abstracts Views on Vision4Press platform.
Data correspond to usage on the plateform after 2015. The current usage metrics is available 48-96 hours after online publication and is updated daily on week days.
Initial download of the metrics may take a while.