| Issue |
A&A
Volume 589, May 2016
|
|
|---|---|---|
| Article Number | A30 | |
| Number of page(s) | 8 | |
| Section | Planets and planetary systems | |
| DOI | https://doi.org/10.1051/0004-6361/201628081 | |
| Published online | 08 April 2016 | |
Influence of porosity on collisions between dust aggregates
Physics Department and Research Center OPTIMASUniversity
Kaiserslautern,
Erwin-Schrödinger-Straße,
67663
Kaiserslautern,
Germany
e-mail:
This email address is being protected from spambots. You need JavaScript enabled to view it.
Received: 6 January 2016
Accepted: 15 March 2016
Abstract
Context. Collisions between dust particles may lead to agglomerate growth or fragmentation, depending on the porosity of the dust and the collision velocity.
Aims. We study the effect of agglomerate porosity and collision velocity on aggregate fragmentation and agglomeration.
Methods. Granular-mechanics simulations are used to study the outcome of head-on dust aggregate collisions. The aggregates are composed of silica grains of 0.76 μm radius and have filling factors of between 0.08 and 0.21. The simulations incorporate repulsive and viscoelastic, dissipative normal forces, and intergrain adhesion. The tangential forces are composed of gliding, rolling, and torsional friction. To study the effect of aggregate porosity, we prepared spherical aggregates with identical radius but differing particle numbers.
Results. The threshold velocity for agglomerate fragmentation decreases with the porosity of the aggregates. Porous aggregates tend to fragment more easily, and the fragments are irregularly shaped. In the agglomeration regime, the merged aggregate is more compact than the initial collision partners. The collision velocity at which compaction is highest is independent of the initial porosity.
Key words: planets and satellites: formation / protoplanetary disks / methods: numerical
© ESO, 2016
1. Introduction
Dust particles are loose aggregates of compact grains. In an astrophysical context, such dust aggregates play an important role. Molecular clouds, dust clouds, and protoplanetary disks are filled with dust aggregates, which, in a simple picture, can be viewed as porous clusters built from small silica grains with sizes of μm and smaller (Draine 2003). Collisions between these dust particles let the cluster-size distribution constantly evolve. High collision velocities lead to cluster fragmentation, while low collision velocities let clusters agglomerate (Paszun & Dominik 2009; Wada et al. 2011; Ringl et al. 2012a). An understanding of the size distribution in dust clouds is not only important for modeling their evolution, but also determines the optical extinction spectra (Ormel et al. 2009);thus Kataoka et al. (2014) and later Min et al. (2016) modeled optical properties – in particular, the opacity – of dust agglomerates in their dependence on agglomerate size and porosity. The surface area available for chemical (catalytic) activity also depends on these quantities (Li & Greenberg 2000).In more general terms, granular aggregates are relevant in many branches of science and engineering, ranging from chemical engineering to geology (Duran 2000), and collisions between such aggregates are ubiquitous and play a decisive role in granular mechanics.
The understanding of the specifics of cluster-cluster collisions with sub-μm-sized grains has started with experimental studies performed by Blum and coauthors in the late 1990s (Poppe et al. 2000; Blum & Wurm 2000; Wurm & Blum 1998; Krause & Blum 2004); this work has been reviewed by Güttler et al. (2010) and Zsom et al. (2010). Blum and coauthors studied collisions of individual silica grains or small aggregates with one another or with flat surfaces, and in particular determined the threshold velocity between cluster agglomeration and fragmentation. More recently, they measured the coefficient of restitution and the fragmentation behavior in microgravity collisions (Schräpler et al. 2012; Weidling et al. 2012; Beitz et al. 2012). For low velocities the coefficient of restitution decreases with increasing velocity and is constant for higher velocities before the onset of fragmentation. These studies were later continued to decimeter-sized aggregates by Deckers & Teiser (2013, 2014). In addition to studies of silica particles, the collisional behavior of water-ice particles was the subject of experimental study. These experiments showed that water-ice particles have an enlarged sticking regime, which is caused by the high surface energy of water (Gundlach & Blum 2015).
Computational studies at the mm-to-cm scale are typically based on continuum-type models. A recent example is given by Ormel et al. (2009), who used input from both experiments and numerical simulations to describe dust collisions. Their work is a follow-up to a series of papers by Tielens and co-workers (Chokshi et al. 1993; Tielens et al. 1994; Jones et al. 1994; Dominik et al. 1995; Dominik & Tielens 1997). However, this type of models might break down at the micrometer and nanometer scale. Here granular-mechanics algorithms, based on so-called discrete-element methods (DEM), may provide more realistic simulations. Collisions of granular aggregates containing a few thousand grains have been performed by Paszun & Dominik (2009) and by Wada and coworkers (Wada et al. 2007, 2008, 2009, 2011; Suyama et al. 2008) as prominent examples.
The compression of aggregates caused by collisions was a prominent early task for DEM-type studies. Suyama et al. (2008) and later Suyama et al. (2012) studied the density evolution of aggregates in head-on collisions. They found that aggregates may be characterized by a fractal dimension of 2.5, and are hence of low density. The authors also provided a density evolution model. Their work was extended to cover collisions of aggregates of unequal size and mass (Wada et al. 2013).
Recently, Wada et al. (2011) and later Seizinger & Kley (2013) analyzed the bouncing behavior of sub-mm sized agglomerates and determined the agglomeration, bouncing, and fragmentation regime using DEM. They studied filling factors >20 % where bouncing is probable. In a DEM study of the collision of porous aggregates of 20% filling factor, Ringl et al. (2012a) found that collision-induced compaction strongly depends on the aggregate size and impact parameters. However, they used a fixed filling factor for their aggregates. We wish to extend this study to higher porosities as are typical in an astrophysical context. In protoplanetary disks, filling factors may be as low as 10-4 (Kataoka et al. 2013; Okuzumi et al. 2012), see also Krijt et al. (2015, 2016). Aggregates this porous are difficult to model. Therefore, we simulated the collision of granular porous aggregates with initial filling factors in the range of 0.08–0.21 using DEM simulations. To study the effect of aggregate porosity, we prepared spherical aggregates with identical radius but different particle numbers. We present results on aggregate compaction and on aggregate fragmentation.
2. Method
2.1. Aggregates
Filling factor, φ0, number of grains, N, and number of contacts, nc, of the aggregates.
Our aggregates are composed of spherical grains; each of the grains possesses the same properties. They consist of SiO2 with a density of ρ = 2 × 10³ kgm-3 (Blum & Schräpler 2004). All grains have the same radius of Rgrain = 0.76μm and a mass of m = 3.68 × 10⁻¹⁵ kg. The radius of the colliding aggregates is R = 30μm. The number of grains in the aggregates varies between N = 5000 and 13 000, depending on porosity.
We constructed spherical aggregates with filling factors varying from φ0 = 0.08 to φ0 = 0.21 by adding randomly grains to a central grain with the constraint of keeping the average filling factor at the predefined value. In detail, we followed a recipe by Ringl et al. (2012b): the local filling factor is calculated for each grain by counting the number of grains in a sphere of radius 5Rgrain around it; the grain with the lowest local filling factor is determined and a new grain is attached to it in a random direction. This procedure is repeated until the prescribed filling factor φ0 has been reached throughout the sphere. The filling factor of an ensemble of N grains – each with a volume  – in a volume V is defined as
  (1)The filling factor thus corresponds to the (relative) density of the aggregate. The quantity 1 − φ0 denotes the porosity of the aggregate. We assemble important characteristics of our aggregates in Table 1.
As a result of our construction process, the aggregates have no fractal structure; in other words, their fractal dimension D amounts to 3. This is in contrast to other aggregate construction algorithms. In their review article, Smirnov (1990) summarized how the (simulated) growth process affects the fractal nature of the aggregate. While ballistic particle-cluster aggregation (BPCA) produces compact clusters with D ≈ 3, ballistic cluster-cluster aggregation (BCCA) results in an open structure with D ≈ 2. We note that a variant of the algorithm used by us here, which lets the agglomerate grow without spatial confinement, produces fractal agglomerates whose fractal dimension can be tuned to a prescribed value (Ringl & Urbassek 2013).
2.2. Simulation setup
The aggregates collide with relative velocities v varying between 1 and 50 m/s. We only consider central collisions of aggregates with the same filling factor. It is known that peripheral collisions result in less compaction because only parts of the aggregates are involved in the collision and a fraction of the collision energy is used to generate rotation (Wada et al. 2009; Ringl et al. 2012a).
To provide some statistics, we averaged over four individual collision events for each value of v. These values differ from each other by a random rotation of the aggregates. The four collision events are sufficient to give us statistically meaningful data in Figs. 6 and 7. We simulated for a time of 2 × 10⁻⁴ s. This total simulated time is long enough for the collisions to provide the final shapes and filling factors of the resulting fragments. The simulation time step was chosen as 50 ps. This time step is by a factor of 50 smaller than the collision time (2450 ps) at v = 100 m/s (Ringl & Urbassek 2012) and hence is sufficiently small to ensure proper integration of the equations of motion. With this time step, we thus integrated our equations of motion over 4 × 10⁶ time steps.
Parallelization of the simulation code requires using a simulation box such that fixed box regions can be assigned to the processors. The box is of cubic shape with a length of 1000 μm in collision direction and a lateral width of 310 μm. We employed periodic boundary conditions and checked that the box size was large enough to minimize possible artifacts caused by the boundary conditions employed. To visualize the snapshots we used the software tools OVITO (Stukowski & Albe 2010) and VMD (Humphrey et al. 1996).
2.3. Forces between grains
The details of our simulation method have been published by Ringl & Urbassek (2012). The algorithm is implemented in the open-source code LIGGGHTS (Kloss et al. 2012). We repeat essential details here for convenience.
The small grain size prevalent in cosmic dust particles necessitates a careful modeling of intergranular adhesion and of friction forces and other dissipative processes occurring between grains (Dominik & Tielens 1997; Wada et al. 2007).
We define the overlap of two grains of distance d as δ = 2Rgrain − d; interactions vanish for δ< 0. The normal force between two grains consists of repulsive and attractive contributions. The repulsive part (Pöschel & Schwager 2005),  (2)consists of a Hertzian δ3/2 contribution, based on elastic theory, and a dissipative part, describing a viscoelastic contact (Brilliantov et al. 1996). Here Rred = Rgrain/ 2 is the reduced radius, M = Y/ [ 2(1−ν2) ] is the reduced modulus, Y Young’s modulus, ν Poisson’s ratio, vn is the velocity component in normal direction, and A is an empirical factor modeling dissipation. The attractive part of the normal force is taken to be proportional to the specific surface energy γ (Derjaguin et al. 1975; Maugis 2000; Blum 2006) as
  (3)The tangential forces between two grains consist of several friction forces. Gliding friction,
  (4)depends on the shear modulus G = Y/ [ 2(1 + ν) ] and the radius
  of the contact area (Burnham & Kulik 1999). Rolling motion is decelerated by a torque (Dominik & Tielens 1997),
  (5)Here, ξyield is the distance that two grains can roll over each other without breaking their atomic contacts. Finally, torsional motion is also decelerated by a torque, whose strength is given by (Dominik & Tielens 1997)
  (6)For more details on the calculation of the forces see Ringl & Urbassek (2012).
In our simulations we employ the material parameters for silica, Y = 54 GPa, ν = 0.17 and γ = 25 mJ/cm2 (Chokshi et al. 1993). The dissipation constant A = 0.5 ns is obtained from a fit to the experimentally measured (Poppe et al. 2000) coefficient of restitution of silica grains (Ringl & Urbassek 2012). The parameter describing rolling friction, ξyield, is taken to be 1 Å (Dominik & Tielens 1997).
2.4. Characteristic energies
Previous work on aggregate collisions introduced a number of characteristic energies to discuss the fragmentation and compaction behavior.
The critical velocity required for the break-up of a bound grain-grain dimer in a central collision amounts to vfrag = 0.17 m/s in our simulations (Ringl et al. 2012a). The general dependence of this velocity on the material parameters of the grains is given by Chokshi et al. (1993) as  (7)where the numerical prefactor depends somewhat on which energy loss modes (e.g., elastic waves) are taken into account. The corresponding (relative) collision energy of two grains
  (8)has been denoted as the break-up energy by Dominik & Tielens (1997); it amounts to 2.66 × 10⁻¹⁷ J in our case.
Aggregate compression requires restructuring of the grain-grain contacts. A minimum energy Eroll is needed to overcome the rolling friction, which Dominik & Tielens (1997) introduced as  (9)With our parameters it is Eroll = 1.125 × 10⁻¹⁶ J. We note that this quantity strongly depends on the poorly known parameter ξyield, which we set to 1 Å following Dominik & Tielens (1997). From laboratory experiments (Heim et al. 1999; Blum & Wurm 2000) a higher value (32 Å) was deduced, and other authors (Ormel et al. 2009) proposed ξyield = 20 Å. These choices proportionally increase Eroll.
Eroll corresponds to a velocity vroll that is given by  ; hence vroll = 0.35 m/s = 2.1vfrag (ξyield = 1 Å).
These scaling parameters allow conveniently converting results obtained for a particular material – here SiO2 – to others and characterizing the dependence of the results on the grain size. For instance, as Wada et al. (2013) pointed out, vfrag is a factor of 10 higher for water ice than for silica. This is a consequence of the fact that surface energies are higher, but elastic moduli and density are lower in ice; all these factors contribute in Eq. (7) to increase the fragmentation velocity in ice.
3. Results
3.1. Time evolution
Figure 1 shows as a prototypical case the dynamics of a collision of two aggregates with initial filling factor φ0 = 0.08 colliding centrally with a velocity of v = 30 m/s. Immediately after impact, t = 5μs, the aggregates strongly deform into a hemispheric shape, and monomers are emitted all over the aggregate surfaces. The evaporation process starts at the aggregate-aggregate interface, but then extends to the entire surface of the two aggregates. Later, t = 10μs, the merged aggregate deforms to a lenticular or pancake shape, resulting in strong intermixing between the grains of the two original aggregates. At t = 25μs, the merged aggregate has started fragmenting and has hence developed a very irregular shape, which starts consolidating at t = 50μs, where the largest fragment has attained an elongated shape. In the final snapshots shown, the aggregate shape does not change appreciably; however, the aggregate is seen rotating. Because the porous initial aggregates have neither a perfect radial symmetric mass distribution nor a smooth surface, a torque is exerted during the collision even for central impact, leading to rotation of the collision product. We note that recently, simulations of collisions between aspherical particles and a wall were able to reveal that even small deviations from the spherical shape can lead to significant energy transfer between the translational and rotational degrees of freedom (Glielmo et al. 2014). Because of their diffuse surface structure, excitation of rotations is more relevant for highly porous aggregates.
Figure 2 displays the final outcome of a typical aggregate-aggregate collision for a larger filling factor of φ0 = 0.179. Here we are already in the fragmentation regime and only the largest resulting aggregate is displayed. Figure 2 shows considerable intermixing of the two original aggregates, but the interface where the two original aggregates met is still clearly visible.
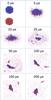 |
Fig. 1 Time series of the collision of two aggregates of filling factor φ0 = 0.08 colliding with a velocity of v = 30 m/s. The aggregates move in vertical direction and collide centrally. Color distinguishes the original aggregates to which a grain belongs. |
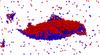 |
Fig. 2 Final snapshot (t = 200μs) after the collision of two aggregates with an initial filling factor of φ0 = 0.179 colliding with a velocity v = 20 m/s. Color distinguishes the original aggregates to which a grain belongs. |
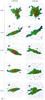 |
Fig. 3 Final snapshots (t = 200μs) after the collision of two aggregates with various initial filling factors φ0 – indicated on the left axis – for two velocities, v = 20 m/s (left) and v = 30 m/s (right). The aggregates move in vertical direction and collide centrally. The color denotes the local density, with red denoting the highest density. |
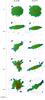 |
Fig. 4 Final snapshots (t = 200μs) after the collision of two aggregates with various velocities v – indicated on the left axis – for initial filling factors φ0 = 0.08 (left) and φ0 = 0.11 (right). The aggregates move in vertical direction and collide centrally. The color denotes density as in Fig. 3. |
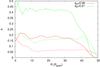 |
Fig. 5 Radial dependence of the filling factor φ in the original and in the collided aggregates. Data are for two initial filling factors φ0 and a collision velocity of v = 5 m/s. |
3.2. Final shapes
Compaction caused by the collision will be inhomogeneous in the final aggregates. We illustrate this feature qualitatively in the snapshots assembled in Figs. 3 and 4. The local density is calculated as a local average over spheres of radius 2.5Rgrain using the tool VOLMAP in VMD (Humphrey et al. 1996). We first discuss the influence of the initial aggregate density on the collision for two different velocities in Fig. 3.
The snapshots demonstrate that filling factors are highest in the center of the agglomerated cluster and decrease toward the surface. The density is heterogeneous inside the aggregates because of the random nature of the aggregate structure. Figure 3 shows that lower velocities lead to more compact aggregates exhibiting a pancake shape. We observe that for v = 30 m/s and φ0> 0.08 parts of the aggregated clusters at their periphery are only loosely connected to the main body of the aggregate. This is consistent with previous findings that fragmentation starts far from the collision axis (Ringl et al. 2012a), at the rim of the pancake structure. For aggregates with low densities we observe deviations from the pancake shape, and irregular forms build up.
This is the reason why we concentrate in Fig. 4 on the aggregates with lowest density; here we study the influence of collision velocity. We note that – with the exception of the lowest collision velocity – the surviving aggregates are always surrounded by evaporated grains. For low velocities, the merged aggregates are roughly spherical and the two initial aggregates have been deformed to approximately hemispheric shape. For impact velocities v> 5 m/s the final aggregates are elongated laterally and have acquired a lenticular or pancake shape. For even higher velocities we observe stronger fragmentation that results in irregularly shaped agglomerates. We note that the surface of aggregates with low initial filling factor exhibits a considerable porosity so that parts of the surface are diffuse. This fluffy surface layer assists in fragmentation. The merged aggregate is rotating for the sample with the lowest filling factor (φ0 = 0.08) and for velocities of more than 20 m/s.
Figure 5 shows the radial dependence of the filling factor of the collided aggregates and compares it with that in the original aggregate. At the collision velocity of 5 m/s the resulting agglomerate is approximately spherical such that it is justified to consider the radial distribution of φ. It is observed that the compaction is quite homogeneous in the interior of the collided aggregates. Toward the outer surface, the filling factor continuously decreases over a range of (30...50) Rgrain for the thinner aggregate and over (35...50) Rgrain for the denser aggregate. This continuous decrease documents the fluffiness of the collided aggregates. We note that the original aggregates show a considerably sharper outer boundary, which falls off only within around 5Rgrain.
3.3. Fragmentation
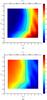 |
Fig. 6 a) Classification of collisions with collision velocity v and initial filling factor φ0 according to the fragmentation number, Ns, Eq. (10), given by the color bar. The black line marks Ns = 0.4, see text. b) Classification by the size of the largest aggregate, N1/N. The black line marks N1/N = 1, Eq. (11). |
Figure 6a presents a quantification of compaction and fragmentation as a function of filling factor and collision velocity. This plot is based on the fragmentation number, Ns, introduced by Kalweit & Drikakis (2006), which characterizes the amount of aggregate destruction. It is defined as  (10)where N1 and N2 denote the numbers of grains in the two largest aggregates found at the end of the simulation. Evidently, both for elastic scattering and for cluster agglomeration, Ns = 0, while for complete cluster fragmentation Ns → 1. To calculate N1 and N2 we used the built-in cluster detection algorithm implemented in LIGGGHTS (Kloss et al. 2012) with a cutoff-radius of 2Rgrain.
As a main result of this study, Fig. 6a quantifies that with increasing velocity and increasing porosity (i.e., decreasing filling factor), agglomeration ceases and fragmentation becomes the dominating process. For filling factors above 11%, the amount of fragmentation does not noticeably depend on the initial filling factor. However, for the more porous aggregates studied here, φ0< 0.11, fragmentation sets in for increasingly lower velocities; porous aggregates tend to fragment more easily. This behavior is highlighted by the black line included in Fig. 6a, which marks Ns = 0.4 and illustrates the influence of aggregate porosity on the fragmentation behavior.
Our thinnest aggregates show a considerably decreased fragmentation velocity. This feature might be connected with the irregular shapes that these highly porous aggregates adopt, see Figs. 3 and 4, even at relatively low collision speeds. These irregular shapes expose grains with only a few contact points where the aggregate may break up into smaller fragments.
Wada et al. (2009) studied under which circumstances aggregate collisions lead to growth, and they used the size of the largest aggregate, N1, to quantify this. We display in Fig. 6b the size of the largest aggregate as a function of collision velocity and aggregate filling factor. The line  (11)separates the regions of growth and of no growth, i.e., fragmentation. We see that this criterion leads to quite similar results as the fragmentation number, Eq. (10), plotted in Fig. 6a. The critical speed for fragmentation decreases strongly in particular when φ0< 0.11.
Wada et al. (2009) studied collisions of aggregates grown by a BPCA algorithm as a function of aggregate mass for fixed filling factor (around 0.15), and hence as a function of the aggregate size. They discussed the critical velocity at which collisions lead to aggregate fragmentation rather than growth, quantified by N1/N ≤ 1 in the language of Eq. (10). They found that the critical velocity slightly increased with N as  (extracted from Fig. 4c of Wada et al. 2009). Since for our φ0 = 0.15 aggregates, N = 9000, this translates into v = 14vfrag = 2.34 m/s. This value is an order of magnitude lower than our data in Fig. 6. This discrepancy has already been discussed previously (Ringl et al. 2012a). We note that experimental data of head-on aggregate collisions containing 1 μm-sized SiO2 grains found fragmentation only at collision velocities of above 10 m/s, in agreement with our simulations (Wurm et al. 2005; Teiser & Wurm 2009).
We conclude that Wada et al. (2009) observed a slight increase of the velocity for fragmentation with N for fixed filling factor. This finding is analogous to our result that the fragmentation velocity increases with the filling factor for a fixed aggregate radius.
Wada et al. (2013) extended their previous study (Wada et al. 2009) to the case of aggregates of unequal mass and stated that v = 10vfrag, independently of the number of grains involved. This result is smaller than ours, as discussed above.
3.4. Compaction
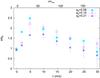 |
Fig. 7 Average filling factor φ of the merged aggregate, normalized to the initial filling factor φ0, after the collision of two aggregates with velocity v. Error bars indicate the statistical error of the data. |
As a result of the collision process, the porous aggregates will compact. We measure compaction with the help of the average filling factor, φ, of the merged aggregate or the largest surviving fragment. The filling factor can be calculated analogously to Eq. (1). Because aggregates are now no longer spherical, the calculation of the aggregate volume, V, needs proper attention. We determined V by calculating the convex hull of the compacted aggregates using the quickhull algorithm (Barber et al. 1996). We note that the calculation of the convex hull is justified as long as the aggregates obey a convex pancake shape. For larger fragmentation and strongly irregular (i.e., partly concave) aggregate shapes, the algorithm slightly underestimates the resulting filling factor. The data for velocity v = 0 included in Fig. 7 are for the initial aggregates. They show that the filling factor calculated using the quickhull algorithm coincides with Eq. (1) within better than 10%. We note that in previous work (Ringl et al. 2012a), we used the average over the local filling factors to determine the average filling factor of an aggregate. The local filling factor was evaluated at the site of each grain as an average over a small spherical environment. While Eq. (1) gives a macroscopic view of the filling factor that is also easily implemented in an experiment, the average over local filling factors makes use of the microscopic structure inside the aggregate.
The filling factors after collision are displayed in Fig. 7. For low velocities of up to vcomp ≅ 5 m/s, the filling factor increases monotonically with velocity. At these low velocities, grains can be pushed closer together without breaking the structure because friction provides effective energy dissipation. Beyond the velocity of vcomp ≅ 5 m/s, the filling factor decreases again with velocity. This effect can be explained by the lateral stress relaxation that leads to the pancake shape of the squeezed aggregates (Ringl et al. 2012a). Hence there is an optimum velocity of vcomp ≅ 5 m/s, where the compaction is strongest. Interestingly, we find in Fig. 7 that the velocity leading to maximum compaction exhibits no statistically reliable dependence on the initial filling factor in the range of porosities studied here. At low velocities aggregates are hemispheric, but then are crushed to pancake shape where they reach the strongest compression.
Dominik & Tielens (1997) set up a model for the collision energy required for strongest compaction and found it to occur at  (12)Here nc is the number of grain-grain contacts in the initial aggregate. The data are assembled in Table 1. The data show that for our aggregates, it is nc = N in good approximation; hence the energy per grain – and thus the collision velocity for maximum compaction – is constant, in agreement with our data in Fig. 7.
Quantitatively, we find the strongest compaction to occur at v/vfrag ≈ 30. Equation (12) with nc = N would predict a velocity of v = vroll = 2.1vfrag. In agreement with our previous study (Ringl et al. 2012a), we find an increased resistance of the aggregates to compaction, in the sense that a higher velocity is needed to compact them.
Our aggregates are dense in the sense that their fractal dimension is 3, and the fractal dimension of the merged aggregate is also 3. Previous studies found that the compaction behavior of fractal aggregates (with initial dimension Di< 3) is qualitatively different: the merged aggregate is found to have an increased fractal dimension, D>Di (Suyama et al. 2008; Wada et al. 2008; Suyama et al. 2012). This finding gives a qualitatively intriguing picture of how thin fractal aggregates become compressed for an increasing fractal dimension of the merged aggregate. However, for our fully three-dimensional aggregates, this reasoning does not apply.
The relative compaction building up is strongest for aggregates that initially had the lowest filling factors, cf. Fig. 7. This is plausible since samples with lower density can restructure more efficiently. We note that compaction occurs only in the agglomeration regime, while the filling factor of the resulting fragments decreases again with velocity in the fragmentation regime.
4. Summary
Granular-mechanics simulations were used to study the influence of aggregate porosity on the collisional behavior of collisions between aggregates. In particular, we investigated the agglomeration, fragmentation, and compaction behavior in central collisions in dependence of collision velocity and porosity. By using spherical aggregates with identical radius but differing particle numbers, we were able to isolate the effect of aggregate porosity on the collision behavior.
It has been known (Ringl et al. 2012a) that the colliding clusters agglomerate at low velocities, but fragment at high velocities. We found here that the critical velocity for fragmentation decreases with decreasing filling factor at the lowest filling factors studied (≤15%).
For low impact velocities the composite agglomerates exhibit regular – spherical or lenticular – shapes, even for the smallest initial filling factors. For higher collision velocities, however, and in particular for high porosities, the shape of the resulting aggregate becomes strongly irregular. In addition, surface layers remain very porous and hence maintain their potential for fostering catalytic reactions.
The strongest compaction occurs in a small velocity window of around 5 m/s. Slower speeds do not provide enough momentum to move grains, and higher velocities tend to fragment the aggregates. We found here that the optimum collision velocity for compaction does not depend strongly on the initial aggregate porosity in the range of porosities studied here.
Acknowledgments
Simulations were performed at the High Performance Cluster Elwetritsch (RHRK, TU Kaiserslautern, Germany).
References
- Barber, C. B., Dobkin, D. P., & Huhdanpaa, H. 1996, ACM Trans. Math. Softw., 22, 469 [CrossRef] [Google Scholar]
- Beitz, E., Güttler, C., Weidling, R., & Blum, J. 2012, Icarus, 218, 701 [NASA ADS] [CrossRef] [Google Scholar]
- Blum, J. 2006, Adv. Phys., 55, 881 [NASA ADS] [CrossRef] [Google Scholar]
- Blum, J., & Schräpler, R. 2004, Phys. Rev. Lett., 93, 115503 [NASA ADS] [CrossRef] [PubMed] [Google Scholar]
- Blum, J., & Wurm, G. 2000, Icarus, 143, 138 [NASA ADS] [CrossRef] [Google Scholar]
- Brilliantov, N. V., Spahn, F., Hertzsch, J.-M., & Pöschel, T. 1996, Phys. Rev. E, 53, 5382 [Google Scholar]
- Burnham, N., & Kulik, A. A. 1999, in Handbook of Micro/Nano Tribology, 2nd edn., ed. B. Bhushan (Boca Raton: CRC Press), 247 [Google Scholar]
- Chokshi, A., Tielens, A. G. G. M., & Hollenbach, D. 1993, ApJ, 407, 806 [Google Scholar]
- Deckers, J., & Teiser, J. 2013, ApJ, 769, 151 [NASA ADS] [CrossRef] [Google Scholar]
- Deckers, J., & Teiser, J. 2014, ApJ, 796, 99 [NASA ADS] [CrossRef] [Google Scholar]
- Derjaguin, B. V., Muller, V. M., & Toporov, Y. P. 1975, J. Colloid Interface Sci., 53, 314 [Google Scholar]
- Dominik, C., & Tielens, A. G. G. M. 1997, ApJ, 480, 647 [NASA ADS] [CrossRef] [Google Scholar]
- Dominik, C., Jones, A. P., & Tielens, A. G. G. M. 1995, Astrophys. Space Sci., 233, 155 [NASA ADS] [CrossRef] [Google Scholar]
- Draine, B. T. 2003, ARA&A, 41, 241 [NASA ADS] [CrossRef] [Google Scholar]
- Duran, J. 2000, Sands, powders, and grains: an introduction to the physics of granular materials (Springer Verlag) [Google Scholar]
- Glielmo, A., Gunkelmann, N., & Pöschel, T. 2014, Phys. Rev. E, 90, 052204 [NASA ADS] [CrossRef] [Google Scholar]
- Gundlach, B., & Blum, J. 2015, ApJ, 798, 34 [NASA ADS] [CrossRef] [Google Scholar]
- Güttler, C., Blum, J., Zsom, A., Ormel, C. W., & Dullemond, C. P. 2010, A&A, 513, A56 [NASA ADS] [CrossRef] [EDP Sciences] [Google Scholar]
- Heim, L.-O., Blum, J., Preuss, M., & Butt, H.-J. 1999, Phys. Rev. Lett., 83, 3328 [NASA ADS] [CrossRef] [Google Scholar]
- Humphrey, W., Dalke, A., & Schulten, K. 1996, J. Mol. Graphics, 14, 33 [Google Scholar]
- Jones, A. P., Tielens, A. G. G. M., Hollenbach, D. J., & McKee, C. F. 1994, ApJ, 433, 797 [NASA ADS] [CrossRef] [Google Scholar]
- Kalweit, M., & Drikakis, D. 2006, Phys. Rev. B, 74, 235415 [NASA ADS] [CrossRef] [Google Scholar]
- Kataoka, A., Tanaka, H., Okuzumi, S., & Wada, K. 2013, A&A, 557, L4 [NASA ADS] [CrossRef] [EDP Sciences] [Google Scholar]
- Kataoka, A., Okuzumi, S., Tanaka, H., & Nomura, H. 2014, A&A, 568, A42 [NASA ADS] [CrossRef] [EDP Sciences] [Google Scholar]
- Kloss, C., Goniva, C., Hager, A., Amberger, S., & Pirker, S. 2012, Prog. Comput. Fluid Dyn., 12, 140 [Google Scholar]
- Krause, M., & Blum, J. 2004, Phys. Rev. Lett., 93, 021103 [NASA ADS] [CrossRef] [MathSciNet] [PubMed] [Google Scholar]
- Krijt, S., Ormel, C. W., Dominik, C., & Tielens, A. G. G. M. 2015, A&A, 574, A83 [NASA ADS] [CrossRef] [EDP Sciences] [Google Scholar]
- Krijt, S., Ormel, C. W., Dominik, C., & Tielens, A. G. G. M. 2016, A&A, 586, A20 [NASA ADS] [CrossRef] [EDP Sciences] [Google Scholar]
- Li, A., & Greenberg, J. M. 2000, in NATO Science Series II: Mathematics, Physics and Chemistry, Solid state astrochemistry, eds. V. Pirronello, J. Krelowski, & G. Manicò (Dordrecht: Kluwer Academic Publishers), 120, 37 [Google Scholar]
- Maugis, D. 2000, Contact, adhesion and rupture of elastic solids (Berlin: Springer) [Google Scholar]
- Min, M., Rab, C., Woitke, P., Dominik, C., & Ménard, F. 2016, A&A, 585, A13 [NASA ADS] [CrossRef] [EDP Sciences] [Google Scholar]
- Okuzumi, S., Tanaka, H., Kobayashi, H., & Wada, K. 2012, ApJ, 752, 106 [NASA ADS] [CrossRef] [Google Scholar]
- Ormel, C. W., Paszun, D., Dominik, C., & Tielens, A. G. G. M. 2009, A&A, 502, 845 [NASA ADS] [CrossRef] [EDP Sciences] [Google Scholar]
- Paszun, D., & Dominik, C. 2009, A&A, 507, 1023 [NASA ADS] [CrossRef] [EDP Sciences] [Google Scholar]
- Poppe, T., Blum, J., & Henning, T. 2000, ApJ, 533, 454 [NASA ADS] [CrossRef] [Google Scholar]
- Pöschel, T., & Schwager, T. 2005, Computational granular dynamics: models and algorithms (Springer) [Google Scholar]
- Ringl, C., & Urbassek, H. M. 2012, Comput. Phys. Commun., 183, 986 [NASA ADS] [CrossRef] [Google Scholar]
- Ringl, C., & Urbassek, H. M. 2013, Comput. Phys. Commun., 184, 1683 [NASA ADS] [CrossRef] [Google Scholar]
- Ringl, C., Bringa, E. M., Bertoldi, D. S., & Urbassek, H. M. 2012a, ApJ, 752, 151 [NASA ADS] [CrossRef] [Google Scholar]
- Ringl, C., Bringa, E. M., & Urbassek, H. M. 2012b, Phys. Rev. E, 86, 061313 [NASA ADS] [CrossRef] [Google Scholar]
- Schräpler, R., Blum, J., Seizinger, A., & Kley, W. 2012, ApJ, 758, 35 [NASA ADS] [CrossRef] [Google Scholar]
- Seizinger, A., & Kley, W. 2013, A&A, 551, A65 [NASA ADS] [CrossRef] [EDP Sciences] [Google Scholar]
- Smirnov, B. M. 1990, Phys. Rep., 188, 1 [NASA ADS] [CrossRef] [Google Scholar]
- Stukowski, A., & Albe, K. 2010, Model. Simul. Mater. Sci. Eng., 18, 085001 [NASA ADS] [CrossRef] [Google Scholar]
- Suyama, T., Wada, K., & Tanaka, H. 2008, ApJ, 684, 1310 [NASA ADS] [CrossRef] [Google Scholar]
- Suyama, T., Wada, K., Tanaka, H., & Okuzumi, S. 2012, ApJ, 753, 115 [NASA ADS] [CrossRef] [Google Scholar]
- Teiser, J., & Wurm, G. 2009, MNRAS, 393, 1584 [NASA ADS] [CrossRef] [Google Scholar]
- Tielens, A. G. G. M., McKee, C. F., Seab, C. G., & Hollenbach, D. J. 1994, ApJ, 431, 321 [NASA ADS] [CrossRef] [Google Scholar]
- Wada, K., Tanaka, H., Suyama, T., Kimura, H., & Yamamoto, T. 2007, ApJ, 661, 320 [NASA ADS] [CrossRef] [Google Scholar]
- Wada, K., Tanaka, H., Suyama, T., Kimura, H., & Yamamoto, T. 2008, ApJ, 677, 1296 [NASA ADS] [CrossRef] [Google Scholar]
- Wada, K., Tanaka, H., Suyama, T., Kimura, H., & Yamamoto, T. 2009, ApJ, 702, 1490 [NASA ADS] [CrossRef] [Google Scholar]
- Wada, K., Tanaka, H., Suyama, T., Kimura, H., & Yamamoto, T. 2011, ApJ, 737, 36 [NASA ADS] [CrossRef] [Google Scholar]
- Wada, K., Tanaka, H., Okuzumi, S., et al. 2013, A&A, 559, A62 [NASA ADS] [CrossRef] [EDP Sciences] [Google Scholar]
- Weidling, R., Güttler, C., & Blum, J. 2012, Icarus, 218, 688 [NASA ADS] [CrossRef] [Google Scholar]
- Wurm, G., & Blum, J. 1998, Icarus, 132, 125 [NASA ADS] [CrossRef] [Google Scholar]
- Wurm, G., Paraskov, G., & Krauss, O. 2005, Icarus, 178, 253 [NASA ADS] [CrossRef] [MathSciNet] [Google Scholar]
- Zsom, A., Ormel, C. W., Güttler, C., Blum, J., & Dullemond, C. P. 2010, A&A, 513, A57 [NASA ADS] [CrossRef] [EDP Sciences] [Google Scholar]
All Tables
Filling factor, φ0, number of grains, N, and number of contacts, nc, of the aggregates.
All Figures
|
Fig. 1 Time series of the collision of two aggregates of filling factor φ0 = 0.08 colliding with a velocity of v = 30 m/s. The aggregates move in vertical direction and collide centrally. Color distinguishes the original aggregates to which a grain belongs. |
| In the text | |
|
Fig. 2 Final snapshot (t = 200μs) after the collision of two aggregates with an initial filling factor of φ0 = 0.179 colliding with a velocity v = 20 m/s. Color distinguishes the original aggregates to which a grain belongs. |
| In the text | |
|
Fig. 3 Final snapshots (t = 200μs) after the collision of two aggregates with various initial filling factors φ0 – indicated on the left axis – for two velocities, v = 20 m/s (left) and v = 30 m/s (right). The aggregates move in vertical direction and collide centrally. The color denotes the local density, with red denoting the highest density. |
| In the text | |
|
Fig. 4 Final snapshots (t = 200μs) after the collision of two aggregates with various velocities v – indicated on the left axis – for initial filling factors φ0 = 0.08 (left) and φ0 = 0.11 (right). The aggregates move in vertical direction and collide centrally. The color denotes density as in Fig. 3. |
| In the text | |
|
Fig. 5 Radial dependence of the filling factor φ in the original and in the collided aggregates. Data are for two initial filling factors φ0 and a collision velocity of v = 5 m/s. |
| In the text | |
|
Fig. 6 a) Classification of collisions with collision velocity v and initial filling factor φ0 according to the fragmentation number, Ns, Eq. (10), given by the color bar. The black line marks Ns = 0.4, see text. b) Classification by the size of the largest aggregate, N1/N. The black line marks N1/N = 1, Eq. (11). |
| In the text | |
|
Fig. 7 Average filling factor φ of the merged aggregate, normalized to the initial filling factor φ0, after the collision of two aggregates with velocity v. Error bars indicate the statistical error of the data. |
| In the text | |
Current usage metrics show cumulative count of Article Views (full-text article views including HTML views, PDF and ePub downloads, according to the available data) and Abstracts Views on Vision4Press platform.
Data correspond to usage on the plateform after 2015. The current usage metrics is available 48-96 hours after online publication and is updated daily on week days.
Initial download of the metrics may take a while.