Free Access
Fig. 4
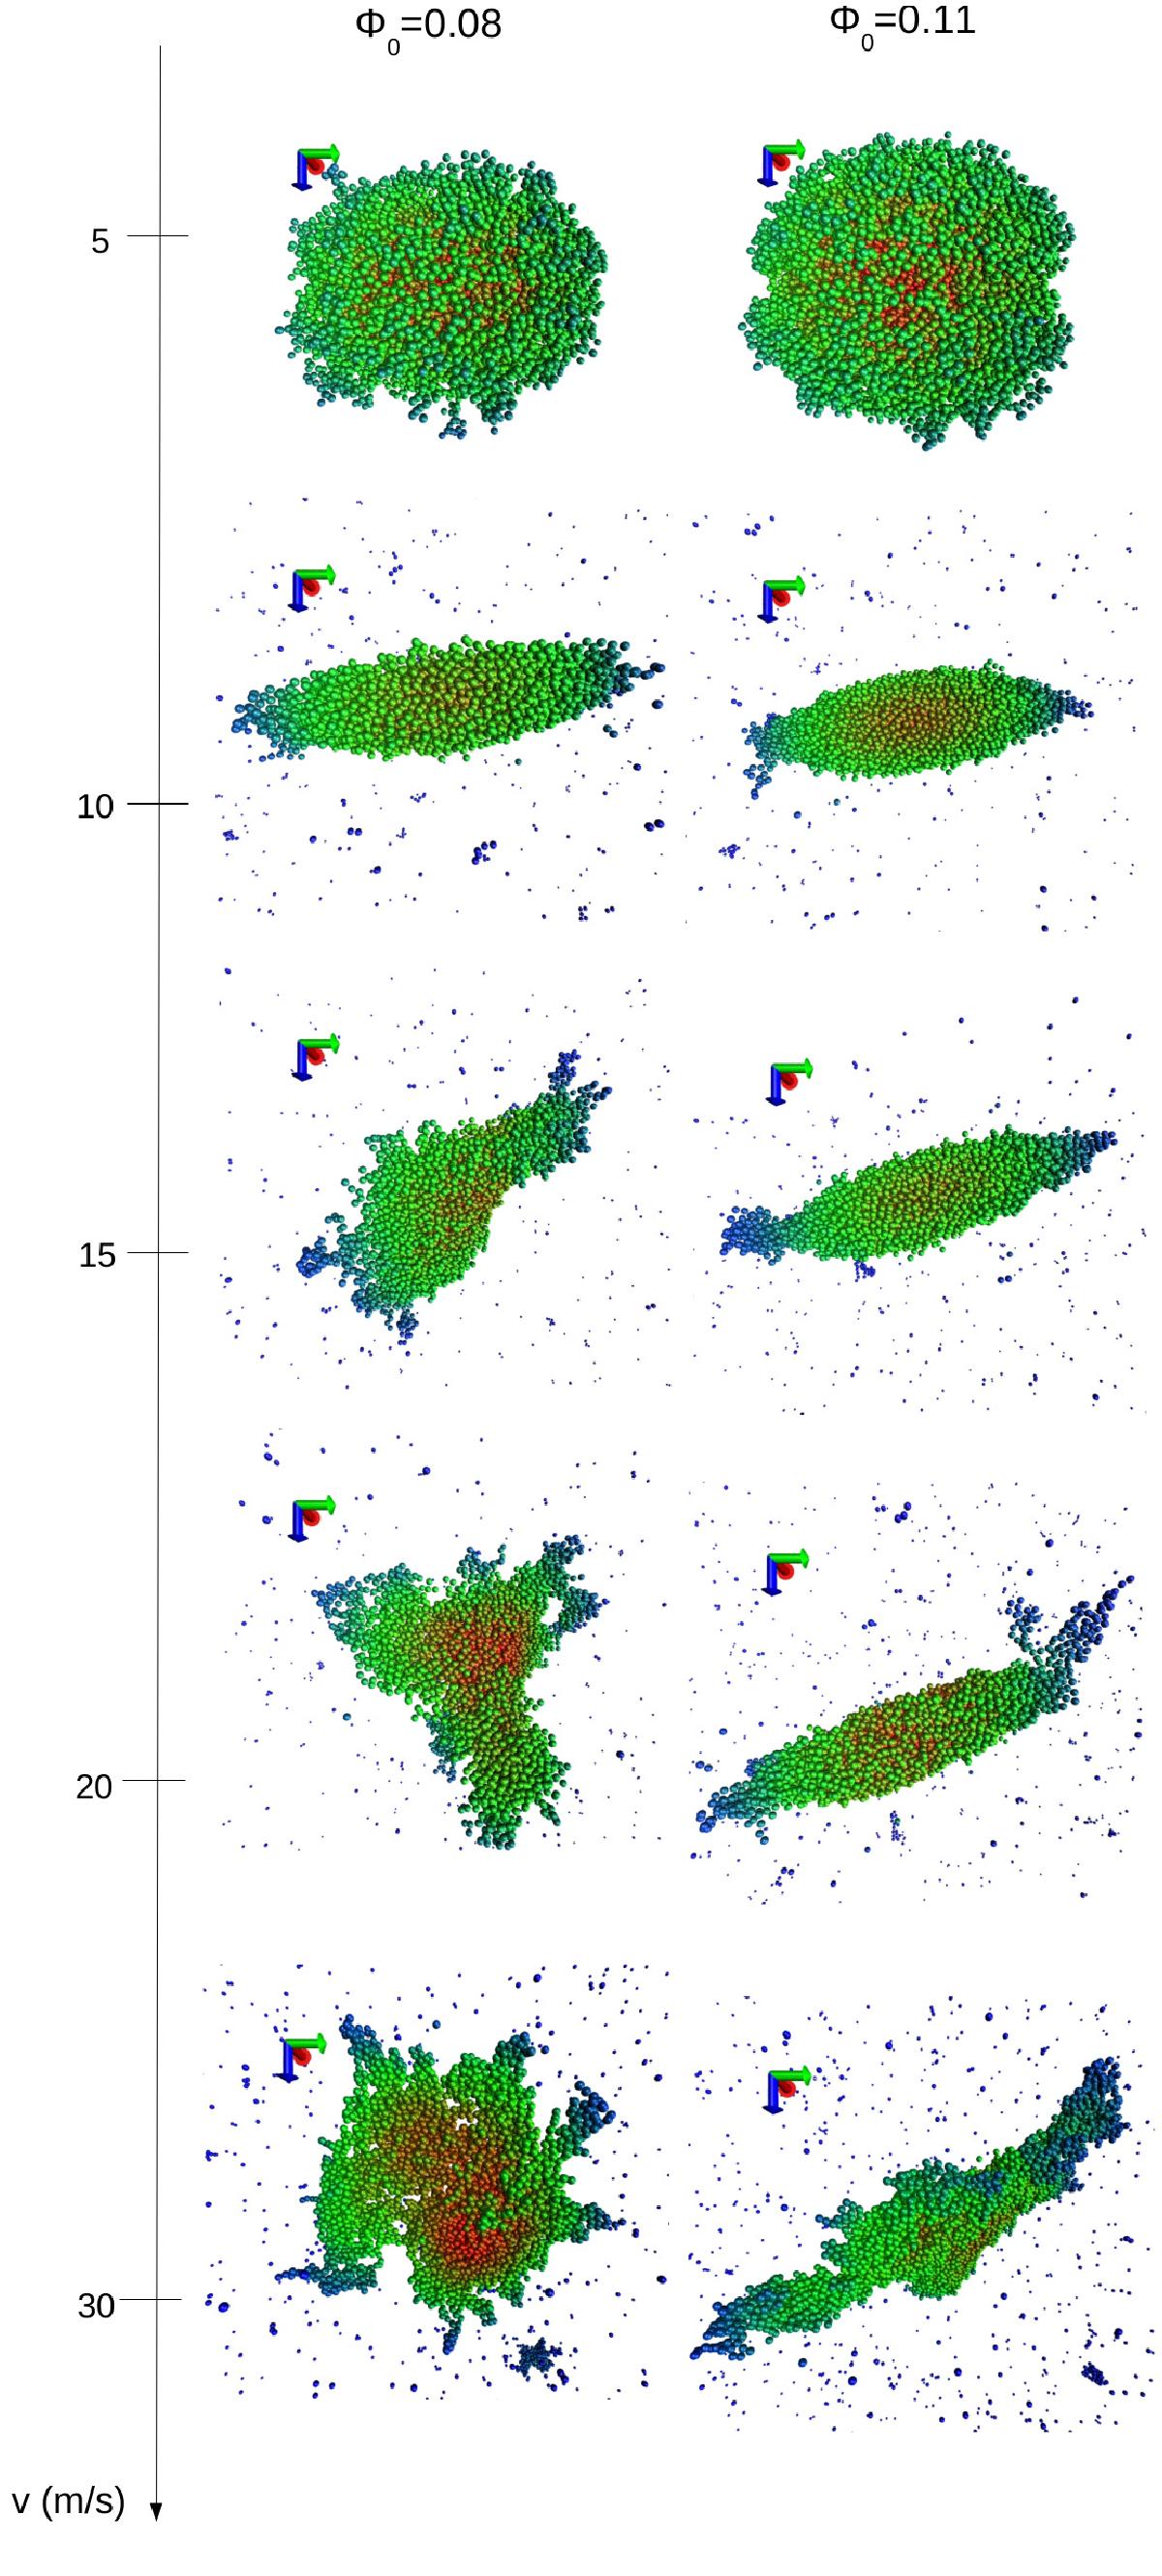
Final snapshots (t = 200μs) after the collision of two aggregates with various velocities v – indicated on the left axis – for initial filling factors φ0 = 0.08 (left) and φ0 = 0.11 (right). The aggregates move in vertical direction and collide centrally. The color denotes density as in Fig. 3.
Current usage metrics show cumulative count of Article Views (full-text article views including HTML views, PDF and ePub downloads, according to the available data) and Abstracts Views on Vision4Press platform.
Data correspond to usage on the plateform after 2015. The current usage metrics is available 48-96 hours after online publication and is updated daily on week days.
Initial download of the metrics may take a while.