| Issue |
A&A
Volume 589, May 2016
|
|
|---|---|---|
| Article Number | A16 | |
| Number of page(s) | 15 | |
| Section | Galactic structure, stellar clusters and populations | |
| DOI | https://doi.org/10.1051/0004-6361/201527823 | |
| Published online | 06 April 2016 | |
The massive stellar population of W49: A spectroscopic survey⋆,⋆⋆,⋆⋆⋆
1
Max-Planck-Institut für Astronomie, Königstuhl 17, 69117
Heidelberg,
Germany
e-mail: This email address is being protected from spambots. You need JavaScript enabled to view it.
2
Department of Astronomy, Stockholm University, AlbaNova University
Centre, 106 91
Stockholm,
Sweden
3
Astronomisches Rechen-Institut, Zentrum für Astronomie der
Universität Heidelberg, Mönchhofstr. 12–14, 69120
Heidelberg,
Germany
4
Argelander Institut für Astronomie, Auf dem Hügel 71, 53121
Bonn,
Germany
Received: 24 November 2015
Accepted: 16 February 2016
Abstract
Context. Massive stars form on different scales that range from large, dispersed OB associations to compact, dense starburst clusters. The complex structure of regions of massive star formation and the involved short timescales provide a challenge for our understanding of their birth and early evolution. As one of the most massive and luminous star-forming region in our Galaxy, W49 is the ideal place to study the formation of the most massive stars.
Aims. By classifying the massive young stars that are deeply embedded in the molecular cloud of W49, we aim to investigate and trace the star formation history of this region.
Methods. We analyse near-infrared K-band spectroscopic observations of W49 from LBT/LUCI combined with JHK images obtained with NTT/SOFI and LBT/LUCI. Based on JHK-band photometry and K-band spectroscopy, the massive stars are placed in a Hertzsprung Russell diagram. By comparison with evolutionary models, their age and hence the star formation history of W49 can be investigated.
Results. Fourteen O-type stars, as well as two young stellar objects (YSOs), are identified by our spectroscopic survey. Eleven O stars are main sequence stars with subtypes ranging from O3 to O9.5 and masses ranging from ~20 M⊙ to ~120 M⊙. Three of the O stars show strong wind features and are considered to be Of-type supergiants with masses beyond 100 M⊙. The two YSOs show CO emission, which is indicative of the presence of circumstellar disks in the central region of the massive cluster. The age of the cluster is estimated as ~1.5 Myr, with star formation continuing in different parts of the region. The ionising photons from the central massive stars have not yet cleared the molecular cocoon surrounding the cluster. W49 is comparable to extragalactic star-forming regions, and it provides us with a unique chance to study a starburst in detail.
Key words: stars: formation / stars: massive / supergiants / infrared: stars / techniques: spectroscopic / open clusters and associations: individual: W49
Based on data acquired using the Large Binocular Telescope (LBT). The LBT is an international collaboration among institutions in Germany, Italy and the United States. LBT Corporation partners are: LBT Beteiligungsgesellschaft, Germany, representing the Max Planck Society, the Astrophysical Institute Potsdam, and Heidelberg University; Istituto Nazionale di Astrofisica, Italy; The University of Arizona on behalf of the Arizona university system; The Ohio State University, and The Research Corporation, on behalf of The University of Notre Dame, University of Minnesota and University of Virginia.
Based on observations made with ESO Telescopes at the La Silla Paranal Observatory under programme IDs 67.C-0514 and 073.D-0837.
The reduced spectra (FITS files) are only available at the CDS via anonymous ftp to cdsarc.u-strasbg.fr (130.79.128.5) or via http://cdsarc.u-strasbg.fr/viz-bin/qcat?J/A+A/589/A16
International Max Planck Research School for Astronomy and Cosmic Physics at the University of Heidelberg (IMPRS-HD).
© ESO, 2016
1. Introduction
Massive stars form in dense regions of giant molecular clouds (GMCs) and interact strongly with their environment. The environments where massive stars form range from dense starburst clusters to loose OB associations. The former are very compact regions with half-mass radii of one parsec or less that are bound by self-gravity (e.g. Rochau et al. 2010), while in the latter OB stars spread over scales from a few to tens of parsec. Such a difference in morphology and physical scale could have a strong influence on the early evolution of the star-forming regions and the stars within them. The near-infrared spectral window provides the possibility to detect radiation from the stellar photospheres of young massive stars, in spite of a visual extinction as high as AV ~ 50 mag.
By investigating the stellar content of star-forming regions, we can try to understand how environmental effects, such as cloud morphology or feedback by massive stars, influence the star formation history. We can address the question of whether clusters form in a single burst with stars all of the same age (Kudryavtseva et al. 2012) or whether they form over a longer time with star formation happening in different parts of a GMC (Blaauw 1991; de Zeeuw et al. 1999; Comerón & Pasquali 2012). There is evidence that the Galactic centre and the Galactic disk are assembling gas into massive clusters in different ways: in the disk, spiral arm density waves, and large scale gas flows that feed a progenitor cloud via filaments seems to be the main mechanism. In the Galactic centre, gas is able to reach very high density without forming stars until possibly cloud-cloud collisions or tidal forces trigger the collapse of gas under its own gravity (Longmore et al. 2014; Johnston et al. 2014).
Massive stars are the main sources of ionising flux and mechanical energy (by means of stellar winds and supernova shock waves) injected into GMCs. By identifying and characterising the massive stellar content, the feedback on the surroundings can be studied in detail. An important question is if and under what circumstances the feedback by massive stars might trigger or quench further star formation (Zinnecker & Yorke 2007).
A study of the spatial distribution of massive stars also provides clues to the formation mechanisms of clusters and massive stars. It is still under debate whether all massive stars form in clusters or if individual OB stars could form in isolation (Bressert et al. 2012; de Wit et al. 2005; Bonnell et al. 2004; Banerjee et al. 2012).
Young massive clusters, where the majority of the very massive stars form and reside during their short lifetimes (Crowther et al. 2010; Bestenlehner et al. 2011; Wu et al. 2014), are the best environments for studying the physical conditions of the birthplaces and the early evolution of most massive stars.
The Luci OBservation of STARburst regions (LOBSTAR) project is a near-infrared spectroscopic survey of the stellar content of several of the most massive star formation complexes in our Galaxy, including W3 Main, W49, and W51. In W3 Main, Bik et al. (2012) classified 15 OB stars and three YSOs, which is indicative of an age spread of at least 2 to 3 Myr between different subregions. The evolutionary sequence observed in the low-mass stellar population via photometry shows that W3 Main is still actively forming stars (Bik et al. 2014). Nine OB stars and one YSO, associated with different H ii regions in W51, have been identified by our spectroscopic classification (Wu et al., in prep.). The wide-spread, multiple-episode star formation has been found to be triggered and affected mainly by external effects such as galactic density wave and the current interaction with a supernova shock wave.
With dozens of massive stars in its core, W49 is one of the most important Galactic sites
for studying the formation and evolution of the very massive stars. Given its location in
the plane of the Milky Way and distance of  kpc (Zhang
et al. 2013), W49 is optically obscured by intervening interstellar dust and is
subject to large amounts of crowding and field star contamination by foreground stars.
kpc (Zhang
et al. 2013), W49 is optically obscured by intervening interstellar dust and is
subject to large amounts of crowding and field star contamination by foreground stars.
Using deep near-infrared imaging, Alves & Homeier (2003) and Homeier & Alves (2005) studied the stellar population and the mass function, and reported the detection of massive stellar clusters still deeply embedded in the GMC of the W49 complex. The observations reveal high extinction towards W49 and large internal extinction variation. At least AV> 20 mag of foreground extinction and more than 30 mag of internal inhomogeneous extinction were found in this region. They derive a total stellar mass of 5–7 × 10⁴ M⊙, which makes W49 comparable to extragalactic giant star-forming regions.
W49 was also the subject of several radio and submillimetre studies (de Pree et al. 1997; Roberts et al. 2011; Nagy et al. 2012, 2015; Galvan-Madrid et al. 2013), which revealed complex kinematics of the molecular gas in W49, with a mixture of infall and outflow motions. There are several clumps of cool and dense gas surrounding and possibly falling into the centre of the region (Roberts et al. 2011). With only 1% of the gas being photoionized, star formation in W49 is ongoing, and the feedback from the cluster is not (yet) strong enough to halt the process (Galvan-Madrid et al. 2013). As comparable physical conditions have been measured in extragalactic starburst regions, W49 could serve as a template for the luminous, embedded star clusters being found in normal and starburst galaxies.
In the following sections, we present our near-infrared observation of W49 from LBT/LUCI and NTT/SOFI. The reduction of the imaging and spectroscopic data is presented in Sect. 2; in Sect. 3 we derive the astrophysical properties of the massive stars, and place them in a Herzsprung Russel diagram (HRD); the fundamental properties of the cluster in W49, its formation history, feedback towards the environment, and the spatial distribution of massive stars are discussed in Sect. 4. The result of our spectroscopic investigation towards W49 is summarised in Sect. 5.
2. Near-infrared observations and data reduction
The observations were carried out with LUCI mounted on the Large Binocular Telescope (LBT, Hill et al. 2006), Mount Graham, Arizona. LUCI is a near-infrared multi-mode instrument capable of Multi-Object Spectroscopy (MOS), long-slit spectroscopy, and imaging (Seifert et al. 2010; Ageorges et al. 2010; Buschkamp et al. 2010). The spectra of the massive stars in W49 were taken in MOS mode based on the K-band pre-image also obtained with LUCI. Additional archival data were used to complement the LUCI data. Medium-resolution (R = 10 000) K-band spectra of five massive stars in W49 obtained with ISAAC mounted on Antu (UT1) of ESO’s Very Large Telescope (VLT), Paranal, Chile, and J- and H-band images obtained with SOFI at the New Technology Telescope (NTT), La Silla, Chile were all downloaded from the ESO archive.
2.1. Observations
2.1.1. Imaging observations
The K-band image of W49 was taken on 2009 September 29 with the N3.75 camera of LBT/LUCI with a total exposure time of 840 s. More details on the imaging observations can be found in Wu et al. (2014).
The archival J and H-band data (first published in Alves & Homeier 2003) were downloaded from the ESO archive and are the same as used in Wu et al. (2014). The observations were performed on 2001 June 7 with NTT/SOFI with a total exposure time of 600 s and 450 s in J and H, respectively. All data were taken under good atmospheric conditions with a typical angular resolution of 0.5′′ to 0.7′′. The effective area covered by all three bands is 5′× 5′.
2.1.2. Source selection for spectroscopic observations
Several selection criteria were applied to select the targets for the followup spectroscopy with LUCI. First, following Alves & Homeier (2003), we selected sources with H − K> 1.2 mag as potential cluster members. Only redwards of this colour were Alves & Homeier (2003) able to detect the embedded clusters. To minimize the fore- and background contamination even more, we selected only sources that are associated with one of the four clusters in W49. The long list of candidate cluster member stars was then used to create the masks for the MOS observations.
Not all stars could be observed using the MOS masks because slits on other stars prevented their selection. Our completeness is dominated by the design of our MOS masks and is worse in the centre of the clusters than in the outskirts. Also we added additional stars to fill in empty places on the masks in regions where no candidate cluster members were left. These additional stars typically violated the selection criteria as described above.
2.1.3. Spectroscopic observations
We observed W49 with the MOS mode of LUCI in the K-band from 2010 May 14
to June 11 and from 2011 April 11 to May 15 under varying atmospheric conditions. We
used the 210_zJHK grating and slit width of 0.7′′ for the masks targeting the brighter
stars, and 1′′ for the
remaining stars. The angular sampling of the spectra is
 pixel-1 with the N1.8 camera, which
provides the largest wavelength coverage (Δλ = 0.328 μm).
pixel-1 with the N1.8 camera, which
provides the largest wavelength coverage (Δλ = 0.328 μm).
In addition to the MOS spectra from LUCI, we reduced a set of archival long-slit
spectra taken with ISAAC in the K band on 2004 August 6, providing a wavelength
coverage between 2.08 μm and 2.20 μm. The spectra were
collected with a angular sampling of  pixel-1. The K-band spectrum of the
very massive star W49nr1 (Wu et al. 2014), is
also part of this dataset. More details on the ISAAC spectra are presented in Wu et al. (2014).
pixel-1. The K-band spectrum of the
very massive star W49nr1 (Wu et al. 2014), is
also part of this dataset. More details on the ISAAC spectra are presented in Wu et al. (2014).
2.2. Data reduction
The reduction of the imaging data and the ISAAC long-slit spectra is described in Wu et al. (2014). The LUCI spectra were reduced with a modified version of lucired, which is a collection of IRAF routines developed for reducing LUCI MOS spectra. The raw frames were first corrected for the tilt of the slit and distortion using spectroscopic sieve and imaging pinhole masks, respectively. The science and standard star spectra were divided by the normalized flat field. The MOS spectra were cut into individual slits and the wavelength calibration was carried out using the Ar and Ne wavelength calibration frames. After the wavelength calibration, the sky background was removed by subtracting two frames adjacent in time or using the procedure by Davies (2007, which corrects for the variations in OH lines by fitting the individual transitions to minimize the residuals), depending on which one of these two methods was more successful in minimizing sky-line residuals. Then the one-dimensional spectra were extracted using the IRAF task doslit. The local background was estimated by fitting a region close to the star with a Legendre function, so that the narrow Brγ emission from the surrounding diffuse nebular structure can be removed from the final spectra. At last the individual exposures for each star are combined into the final spectra.
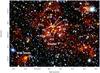 |
Fig. 1 JHK composite colour image of the central 12 pc × 9 pc of W49. North is up, and east is to the left. The red, green, and blue channels are mapped to the K, H, and J, respectively. The J and H-band images are from NTT/SOFI, and the K-band image is from LBT/LUCI. The spectroscopically identified OB-type stars are marked by yellow squares. Two young stellar objects are marked with cyan circles. Two radio sources (W49 South and CC, also associated with subclusters) are labelled in white. |
In preparation for telluric correction, the Brγ absorption line in the spectrum of the telluric standard star was removed by fitting the line with a Lorentzian profile. The resulting atmospheric transmission spectrum was used with the IRAF task telluric to correct the science spectra. After comparing the science spectra corrected with the telluric standard stars taken before and after the science exposure, we selected the science spectra with the least telluric residuals. Finally, the spectra of the science targets were normalized and presented. A residual Brγ emission component remains due to intensity variations of the nebular emission on small spatial scales.
In total, good quality spectra of 44 stars have been obtained with identifiable features in their continuum. Half of them have spectra dominated by CO absorption bands and other atomic absorption lines (Table A.2). They are identified as late-type foreground dwarf and giant stars and are not members of W49, so are not discussed in this paper. The remaining 22 stars (Table A.1) show the spectral features of massive stars and YSOs and are candidate members of W49. In the following, their membership to W49 is discussed in more detail.
3. Results
In this section we present both the near-infrared photometry and the K-band spectroscopy data for W49. Based on both the imaging and spectroscopy, we identify different classes of objects and derive the spectral type of the identified massive stars.
3.1. Photometric classification
Near-infrared imaging of the W49 star-forming region shows that this region is dominated by a dense central cluster surrounded by smaller sub-clusters (Fig. 1). Due to the large distance of W49, high extinction and high foreground contamination make it impossible to reliably determine cluster membership on photometry alone. This is clearly demonstrated by the observed H − K,K colour–magnitude diagram (CMD, Fig. 2), which shows a continuous spread in colour, without a clearly identifiable reddened main sequence as the reddened cluster population. The J − H, H − K colour–colour diagram (CCD, Fig. 3) shows that the wide range in H − K colour corresponds to an extinction range of AK = 0 to 5 mag when applying the extinction law of Indebetouw et al. (2005).
To get an idea of the stellar population in W49, Alves & Homeier (2003) and Homeier & Alves (2005) applied a H − K ≥ 1.2 mag colour cut (equivalent to AK = 2.1 mag), based on the clustering of the stars. As described in Sect. 2, we selected stars in a similar fashion for our spectroscopic observations. In the rest of this section, we focus on the photometric properties of the stars selected for spectroscopy.
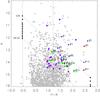 |
Fig. 2 H − K vs. K colour–magnitude diagram of W49. All sources identified in JHK, with errors less than 0.1 mag and with K ≤ 16 mag plotted in grey. The blue diamonds represent the spectroscopically identified OB stars, red triangles are the YSOs with CO emission in their spectra, while the green squares indicate the location of the stars with Brγ absorption lines as the most obvious feature, which cannot be classified due to a lack of other features (see discussion in the text). The purple circles are the 22 late type stars idenfied as fore- or background stars. The dashed vertical line represents the unreddened isochrone for main sequence stars with an age of 1 Myr (Ekström et al. 2012; Yusof et al. 2013). The black star symbols on the dashed vertical line mark the O stars with subtypes O3V to O5V with a step of 1, and O5V to O9.5V in steps of 0.5. The black stars in the bottom right mark the locations of O stars of different subtypes for AKs = 5 mag. The two diagonal dashed lines indicate the reddening directions of an O3V and O9.5V star according to the extinction law of Indebetouw et al. (2005). |
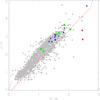 |
Fig. 3 J − H, H − K colour–colour diagram of W49 for only the 22 sources discussed in the paper. The late type stars are not included here. The symbols have the same meaning as described in Fig. 2. The two black dashed lines represent main sequence isochrones with the age of 1 Myr, and the initial mass ranges from 0.8 to 500 M⊙ from Ekström et al. (2012) and Yusof et al. (2013) without being reddened (bottom left) and being reddened with AKs = 5 mag (upper right). The red diagonal line represents the reddening law according to Indebetouw et al. (2005). |
Spectral types of the massive stars in W49.
The observed JHK magnitudes of the spectroscopically observed stars are listed in Table A.1. Almost all stars are detected in JHK, allowing a characterisation of the sources using the CMD and CCD. Exceptions including source #10, which is only detected in K and is blended with brighter stars in J and H. The crowding in the K band still results in a high photometric uncertainty. Source #15 is not detected in J because this source is highly reddened so too faint.
All the spectroscopically observed stars are marked in the CMD and CCD, as well as the applied H − K ≥ 1.2 mag colour cut. The locations of the spectroscopically identified massive stars (see Sect. 3.3) show that the cluster is indeed extremely reddened and that extinction within W49 is highly variable.
In the CMD, the black star symbols indicate the positions of different subtypes of main sequence stars ranging from O3V to O9.5V taken from Martins & Plez (2006), when adopting the extinction law of Indebetouw et al. (2005) and assuming a distance of 11.1 kpc (Zhang et al. 2013) for W49. The reference points are then reddened by AKs = 5 mag. The spectral types of the candidate massive stars can be estimated by comparing the positions of the observed stars in the CMD with the reddened main sequence. The resulting photometric spectral types are given in Table 1 and can be compared to our spectral classification based on the LUCI spectra (Sect. 3.3). Most stars are classified between O3V and O9.5V, suggesting that they are massive stars inside W49. Some stars appear to be more luminous than a single O3V star. In these cases a spectral classification is mandatory to reveal the true nature.
As discussed in Wu et al. (2014) the choice of the extinction law will have a significant effect on the dereddened magnitudes and therefore on the photometric spectral type. We use the extinction laws of Indebetouw et al. (2005), Fitzpatrick (1999), Nishiyama et al. (2009), and Rieke & Lebofsky (1985), whose slopes are consistent with the observed colours in W49, to estimate the uncertainty due to different extinction laws on the photometric spectral type. Different extinction laws result in two to three subtype uncertainties in the photometric spectral type determination. The extinction law by Fitzpatrick (1999) yields earlier subtypes, Nishiyama et al. (2009) yields later subtypes, while Indebetouw et al. (2005) and Rieke & Lebofsky (1985) give comparable results in between the previous two.
3.2. Excess sources
In addition to stars located on or near the reddening line of the CCD (Fig. 3), several sources are located to the right of the reddened main sequence. These stars possibly possess an intrinsic infrared excess due to circumstellar material. In general the fraction of infrared excess sources is a strong function of the age of a stellar cluster (e.g. Hernández et al. 2008). Additionally, dispersion of circumstellar material is driven by external factors like photo evaporation (Hollenbach et al. 2000) or dynamical interactions with surrounding stars (Olczak et al. 2010), resulting in a much lower disk fraction in massive stellar clusters (e.g. Stolte et al. 2010, 2015; Fang et al. 2012; Bik et al. 2014).
For W49 we cannot determine a reliable disk fraction, because we cannot separate the cluster members from the fore- and background stars with the current data. However, we can identify individual YSOs and discuss their likelihood of being a member of the cluster. Two of the most extreme excess sources in the CCD are covered by our LUCI spectra (Fig. 4). Both sources (#4 and #21) have an extremely red colour H − K > 2.4 mag. Source #4 has been identified by Conti & Blum (2002, their No. 2) as a candidate OB star, by Homeier & Alves (2005) as a candidate for very massive star with a mass in excess of 120 M⊙, and by Saral et al. (2015, No. 7 in their Table 10) as a candidate YSO with a mass estimate of ~8.9 M⊙ (Table 1). We note that the last result is based on SED fitting and relies on 2MASS and Spitzer/IRAC photometry, so might be affected by crowding and blending. The YSOs are marked by red triangles in the CMD and CCD of Figs. 2 and 3. Their location in the upper right-hand corner of the CCD suggests that they have a similar extinction as the candidate O stars in W49 and that their extreme H − K colour is caused by the infrared excess emission.
The K-band spectra show the CO ν = 2–0 and 3–1 overtone bands at around 2.3 μm in emission, which is frequently observed in YSOs (Bik & Thi 2004; Bik et al. 2006; Stolte et al. 2010; Wheelwright et al. 2010). In addition to CO, star #4 also shows Brγ and Fe ii 2.089 μm emission. The Brγ absorption line in the spectrum of #21 is caused by over-subtraction of the diffuse nebular Brγ emission.
The CO emission very likely arises from the neutral (~2000 K) dense inner regions of the disk (Bik & Thi 2004; Wheelwright et al. 2010), while the Brγ emission originates in the surrounding H ii region, as well as in the ionized regions of the circumstellar disk. The Fe ii emission in the spectrum of #4 is seen in several high-luminosity objects and could be caused by UV fluorescence (McGregor et al. 1988).
Physical parameters of the OB stars.
Since we do not know the relative contribution of the disk and the star to the total observed flux, we cannot determine the spectral type of the underlying star via photometry. The presence of Brγ and Fe ii lines in the spectrum suggests that the central source is a hot and probably massive star. Similar to Bik et al. (2006), we try to estimate the spectral type of the underlying star by comparing its location in the CMD with that of well-studied massive YSOs. Bik et al. (2006) constructed a CMD from the dereddened J − K colour and the absolute K magnitude (their Fig. 1). By applying an average extinction towards W49 of AK = 3 mag (Table 2) and a distance modulus of 15.22 mag, we derive absolute magnitudes of MK = −5.5 mag and MK = −3.9 mag for #4 and #21, respectively. The dereddened J − K colours are 0.8 mag (#4) and 1.3 mag (#21). Placing the objects into the diagram of Bik et al. (2006) shows that their central stars are most likely late O stars and that they have a rather blue SED with little dust present. Bik et al. (2006) explain this as a result of disk dispersal. The outer regions of the disk are dispersed faster than the inner region and a small and hot inner disk remains before the disk is totally destroyed by the UV photons.
3.3. Spectral classification of the massive stars
Our total spectroscopic sample consists of 44 sources (Tables A.1 and A.2). Twenty-two of those sources have spectra dominated by CO absorption bands and other atomic lines. These stars are of spectral type G or later and are identified as foreground or background stars so are not analysed further.
Of the remaining 22 stars (Table A.1), the two YSOs have been discussed in the previous section. The other 20 stars show spectral features typical of OB stars. Eleven of them show absorption line spectra typical for O main sequence stars (Fig. 5). Two stars show B type spectra and four have low S/N spectra and cannot be classified properly. In Sect. 3.3.1 we discuss the classification of these objects in more detail. Three remaining objects show emission line spectra suggestive of a stellar wind (Fig. 6). Their classification is discussed in Sect. 3.3.2.
3.3.1. OB main sequence stars
 |
Fig. 4 Normalized K-band spectrum of two stars identified as YSOs in W49. The most important features are the CO emission lines at the long wavelength end of their K-band spectra. |
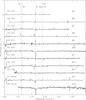 |
Fig. 5 Normalized K-band spectrum of OB type stars in W49 as taken with the multi-object mode of LUCI. The star number and the spectral type based on the spectroscopic classification are indicated above the corresponding spectrum. Indicated with dashed lines are the spectral features crucial for spectroscopic classification. |
The spectra of the OB stars all show Brγ absorption originating in the stellar photosphere. Some Brγ profiles show a narrow emission component in the centre originating in the surrounding H ii region. As discussed in the data-reduction section, we tried to correct the spectra for nebular emission by fitting and subtracting the background. Nevertheless, residuals are still left in some spectra because of the small-scale variations in the nebular emission. Other lines used for derivating the spectral type are the 2.10 μm (N v), 2.113 μm (He i), 2.116 μm (N iii), and 2.189 μm (He ii) lines.
The LUCI spectra of the massive stars have been visually compared to high-resolution K-band spectra of reference O and B type stars with optical classification from Hanson et al. (1996, 2005) and Bik et al. (2005). The high-resolution spectra of Hanson et al. (2005) and Bik et al. (2005) are rebinned to the resolution of the LUCI spectra, and artificial noise was added to the reference spectra to degrade them to the S/N level of the LUCI spectra. The errors on the spectral types are derived where visual comparison shows clear mis-matches between the observed and reference spectra. Typically, the error is 1 or 2 subtypes.
As shown in Table 2, 11 out of the 22 stars are identified as OB main sequence stars. Almost all spectra are classified as early type O stars (earlier than O7V) because they all show He ii and N iii in their spectra, which is indicative of a high effective temperature. To better refine the spectral classification, we used the absence of the He i (2.11 μm) line as an indicator for stars with spectral types between O3V and O5V. The strength of the Brγ and HeII absorption lines varies from star to star (see also Hanson et al. 1996, 2005), probably due to stellar wind variations. Therefore matching the strength in the spectra with those of reference spectra will not result in a good spectral type estimate.
Some stars (e.g. #3 and #8) show strong contamination by nebular emission of He i, and therefore this line cannot be used as a discriminant between early O and mid O stars. Two stars (#6 and #13) are classified as early B stars.
Four relatively faint stars among our sample (#16, #19, #20, and #22) have low S/N. No obvious features except the broad Brγ absorption lines are found in their spectra. This would classify them as early type, however a more detailed classification is not possible. As they are fainter than the stars classified above, we suspect that they are lower mass cluster members and possibly late-O or early-B stars.
Five stars are observed both with LUCI and with VLT/ISAAC and are marked by † symbols after their name in Table 2. The first one is the very massive star reported in Wu et al. (2014, W49nr1). The other four were identified as O3V to O5V stars according to their ISAAC spectra. The ISAAC spectra confirm the spectral classification derived from the LUCI spectra.
3.3.2. Spectral classification of very massive stars
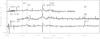 |
Fig. 6 Normalized K-band spectra of Of type stars in W49 as taken with the multi-object mode of LUCI. The star number and the spectral type from spectroscopic classification are labelled above the corresponding spectrum. Indicated with dashed lines are the spectral features crucial for classification. |
In addition to W49nr1 (#1 in this paper) presented in Wu et al. (2014), we have identified two additional stars (#2 and #15) whose spectra display broad Brγ and He ii emission lines (Fig. 6). Additional lines of He i and N iii are visible as well. We did not detect the N v line at 2.10 μm in #2; it was only detected in #1 and #15. These spectral features are indicative of a strong stellar wind and a high effective temperature, and we apply the same classification criteria as done for #1 in Wu et al. (2014).
The sum of the equivalent widths of their Brγ and He ii lines (14.3 ± 2.5 Å for #2 and 4.4 ± 1.2 Å for #15, respectively) corresponds to a spectral type O2-3.5If* in the classification scheme proposed by Crowther & Walborn (2011), while the value for slash stars (Of/WN) is in the range of ~20–70 Å and higher than ~70 Å for Wolf-Rayet stars. This criterion classifies #2 as a slash star with strong wind features. The absence of the N v line in the spectrum of #2 implies a later subtype and a lower temperature when compared to #1 and #15.
A comparison with reference stars with spectral types O3If*, O4If, O5If, and O5.5If from Hanson et al. (2005) shows the presence of the N v line at 2.10 μm in O3If* stars and some of the O4If stars. Accordingly #2 is classified as a later type (O4If-O5.5If), while #15 has an earlier type (O3If*-O4If). Even though the reference stars do not include the spectral type O2If*, the temperature range obtained from the spectroscopic analysis suggest that stars #1 and #15 can be as early as O2If*.
3.4. Photometric vs. spectroscopic spectral type
After the spectral classification of all the massive stars, we can now compare our photometric spectral types derived in Sect. 3.1 to those derived from the LUCI spectroscopy. Most of the O type stars have photometric spectral types similar to the spectral types derived from spectroscopy, such as #3, #5, #7, #9, #11, #12, and #17. For the two B stars (#6 and #13), however, we find a large discrepancy. The difference between the photometric and spectroscopic spectral type suggests that these stars are located at a closer distance than W49. In fact, their location in the CCD (Fig. 3) shows that they have a lower extinction than the other massive stars, consistent with a closer distance. Therefore we identify stars #6 and #13 as foreground stars.
We identify five stars located above the reddening line of an O3 star in Fig. 2. Stars #4 and #21 are spectroscopically identified as YSO and have an infrared excess contributing to the H- and K-band flux. The VMS stars (#1, #2, #15) are also located above the O3 line. This is partly because they are more luminous than O3V stars because they are super giant stars. Additionally, their infrared colours are different from main sequence stars due to the presence of a strong stellar wind (see below).
Additionally, two stars classified as O3-O7 main sequence stars (#3 and #8) are brighter than expected for an O3V star. Both stars are located in the radio source CC. Several explanations could be given for this discrepancy. The limitations of the empirical spectral libraries mean that the earliest spectral type available for classification is O3V. Using stellar parameters taken from Martins et al. (2005, Table 1), this spectral type corresponds to an effective temperature of 44 600 K. Because of this limitation, our O3 spectral classification also includes all stars hotter and brighter than O3V stars. Another possibility is that the radio source CC could be a different star forming complex in the foreground. Placing star #3 on the O3V line would require a distance of 7.1 kpc.
Additionally, we compare our spectral types of the 22 stars to the mid-infrared classification by Saral et al. (2015). We find 11 sources in common, their classifications are listed in Table 1. In general we find a reasonable agreement between ours and Saral’s classification. The mid-infrared photometry of sources located in the small HII regions, #2 in W49 South, and #8 in CC, are likely contaminated by the diffuse emission due to the large beam of Spitzer/IRAC. The higher the number in our source list, the fainter its K-band magnitude, making the contamination of diffuse emission more important.
4. Hertzsprung-Russell diagram
After the spectroscopic classification, we were able to place the 11 OB stars and the 3 VMS stars in the HRD and we compared their locations with those of stellar evolution models. The effective temperature of O type main sequence stars is taken from Martins et al. (2005), while the bolometric correction and the intrinsic H − K colours are from Martins & Plez (2006). By assuming the Indebetouw et al. (2005) extinction law, AK was derived. For star #10, which only has K-band photometry, the extinction is taken from the value of its nearest neighbour, #1. With these parameters in hand, we can determine both the absolute bolometric magnitude and luminosity of the newly discovered massive stars (Fig. 7). We use the stellar evolution tracks from the Geneva models (Ekström et al. 2012; Yusof et al. 2013) to derive the masses of the stars. The derived masses range from ~20 M⊙ to ~120 M⊙ for these stars. Those numbers, along with other parameters derived for the massive stars, are compiled in Table 2. The large uncertainties in the locations of the stars are dominated by the uncertainty in the spectral classification. The HRD is shown in Fig. 7, where the isochrones for 1 Myr, 1.5 Myr, 2 Myr, and 3 Myr (Ekström et al. 2012; Yusof et al. 2013) are plotted, together with the zero age main sequence (ZAMS, Lejeune & Schaerer 2001).
Because O3 is the earliest spectral type available for classification, our O3 spectral classification also includes all stars hotter than 44 600 K. In the HRD for W49 (Fig. 7), stars with spectral types from O3 to O5 could be located at higher effective temperature than indicated, which would also affect their location with respect to the isochrones. A dedicated spectral modelling of the observed spectra is the way to overcome this limitation.
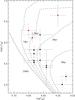 |
Fig. 7 Hertzsprung-Russell diagram (HRD) of the massive stars in W49. The solid line represents the zero age main sequence isochrone from Lejeune & Schaerer (2001). The dashed lines are main-sequence isochrones for 1, 1.5, 2, and 3 Myr from Ekström et al. (2012) and Yusof et al. (2013). The stars are dereddened using the extinction law of Indebetouw et al. (2005). Three very massive stars are indicated by red dots, while OB main sequence stars are indicated by black dots. |
To place #1, #2, and #15 on the HRD, we derived Teff and luminosity based on a grid of synthetic spectra computed with the non-LTE radiative transfer code cmfgen (Hillier & Miller 1998). The stellar atmosphere models contain the following model atoms: H i, He i-ii, C i-iv, N i-v, O i-vi, Si ii-iv, and Fe i-vii. We set the surface gravity log g = 4, the wind parameter β = 1.0, the volume filling factor fv = 0.25, the luminosity to log L/L⊙ = 6, and the terminal velocity to typical values for O dwarfs. The effective temperature (Teff) and the mass-loss rate (Ṁ) were varied between 30 000 and 50 000 K and log (Ṁ/M⊙) = −5 and − 6.5, respectively. The luminosity of our targets were estimated by extracting absolute magnitudes and intrinsic colours from the synthetic spectra.
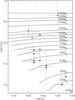 |
Fig. 8 Hertzsprung-Russell diagram (HRD) of the massive stars in W49. The solid lines represent the evolutionary tracks from Ekström et al. (2012) and Yusof et al. (2013). See Fig. 7 for an explanation of the symbols. |
From the best-fitting models we estimated Teff and extracted the intrinsic H − K colour. The intrinsic colour was used to determine the extinction in the K-band (AK) by applying the extinction law of Indebetouw et al. (2005). The absolute K-band magnitudes were calculated by subtracting AK and the distance modulus from the apparent magnitudes. The actual luminosity of the three stars was obtained by rescaling the stellar model spectrum with a luminosity of log L/L⊙ = 6 to match the observed absolute magnitudes.
As a comparison to Geneva models, we apply the relation between the luminosity and the
present-day stellar mass with the upper limit from homogeneous hydrogen burners and lower
limit from helium burners (Gräfener et al. 2011).
When adopting a hydrogen fraction of  , the upper mass limit would be in the range
of 110–130 M⊙ for #1, 200–240 M⊙ for #2, and
90–100 M⊙ for #15, in agreement with the masses
estimated from tracks of massive star evolution. In case the three stars are helium burners,
lower limits on their masses would be around 50 M⊙, 90 M⊙, and 40
M⊙, respectively.
, the upper mass limit would be in the range
of 110–130 M⊙ for #1, 200–240 M⊙ for #2, and
90–100 M⊙ for #15, in agreement with the masses
estimated from tracks of massive star evolution. In case the three stars are helium burners,
lower limits on their masses would be around 50 M⊙, 90 M⊙, and 40
M⊙, respectively.
While the estimated upper mass limit of #2 is considerably higher than the proposed upper mass limit of 150 M⊙ (Figer 2005; Koen 2006), the likelihood that very massive stars are binary or multiple systems is also very high. X-ray observations can serve as diagnostics under the assumption that the intrinsic X-ray luminosity of single O stars can be approximated by LX/LBol ~ 10-7 (Chlebowski et al. 1989; Crowther et al. 2010). Colliding supersonic stellar winds in early type binaries will produce additional X-ray flux from the shock-heated material in the wind interaction region (Stevens et al. 1992). In our OB stars sample, only stars #1, #2, and #12 are detected as bright X-ray sources by XMM and Chandra (Leisa Townsley, private communication), suggesting that they might be colliding-wind binaries. If this was the case, the masses of the individual components of these sources could be lower than the above estimate.
5. Discussion
5.1. Cluster properties of W49
5.1.1. Cluster age
On the HRD (Fig. 7), we overplotted the main sequence isochrones for different ages from the Geneva evolutionary model (Ekström et al. 2012; Yusof et al. 2013) and compared the locations of the massive stars with the isochrones. Within the uncertainties, all stars (maybe with the exception of star #18) are consistent with a 1.5 Myr isochrone. Smaller error bars would be required to make a definite statement about a possible age spread.
5.1.2. Cluster mass
By extrapolating the mass function to the mass range 1 to 20 M⊙, Homeier & Alves (2005) used their photometric analysis to deduce a total stellar mass of 5 to 7 × 10⁴M⊙ for a 5′ × 5′ (16 × 16 pc) region centred on cluster 1. This estimate is limited by contamination with field stars, even after colour selection. To quantify this contamination requires that the spectroscopy of every star or proper motion measurements removes the fore- and background stars by their different spatial velocities (e.g. Stolte et al. 2015).
We can still try to place constraints on the shape of the IMF of W49 and determine whether the presence of three very massive stars (VMS) is consistent with the derived cluster mass by Homeier & Alves (2005) and a typical high-mass slope of –2.35 the IMF (Salpeter 1955; Kroupa 2001) We randomly sampled 1000 times a Kroupa (2001) type mass function by drawing 200 high-mass stars between 20 and 400 M⊙, corresponding to a total cluster mass between 5–7 × 10⁴M⊙. We find that of these 200 stars, on average 10 ± 3 stars are expected to be more massive than 150 M⊙. In W49 we have detected three VMS stars spectroscopically, suggesting that this detection is perfectly normal, and it does not suggest any oddity in the mass function of W49. Since we cannot quantify our spectroscopic completeness, we might have missed several VMS stars. The CMD (Fig. 2) shows several bright stars near the location of the spectroscopically detected VMS stars.
5.2. Feedback
Massive stars have a strong impact on their formation sites. The ionizing radiation and stellar winds of the massive stars are able to alter the state of the interstellar medium (ISM) and halt star formation or trigger new episodes. Observations of the ISM (e.g. Peng et al. 2010; Galvan-Madrid et al. 2013) show the effect of the stellar feedback on the ISM. Simulations suggest that the hydrogen ionizing photons have a more destructive effect than the mechanical feedback of the stellar winds of massive stars (Dale et al. 2013), however none of the two mechanisms is sufficient to fully destroy a GMC of ~106M⊙ surrounding a massive cluster.
The energy and momentum input in the ISM can be quantified by a characterisation of the massive stars. The spectral classification of the massive stars in W49 also results in an estimate of the number of ionizing photons (Q0) emitted by each star and the stellar wind parameters. From Martins et al. (2005), we take the numbers of ionising photons emitted from stars with a certain spectral type. The ionising fluxes are rescaled with luminosities of individual stars and the final result listed in Table 2. (#1, #2, and #15 have the ionizing flux directly from photospheric modelling.) The total amount of ionizing photons emitted in W49 is dominated by the three VMS (1050.45 ~ 50.59 s-1) and adds up to a total of (1050.94 s-1) for the entire cluster (see Table 2).
We can compare the number of ionizing photons with the radio flux emitted by W49. The radio free-free flux of the H ii region is a direct proxy of the number of ionizing photons so it can be compared with the stellar ionizing photons according to the spectral types we have derived. Low spatial resolution radio observations from Kennicutt (1984) provide us with the total integrated radio flux of the entire H ii region. Kennicutt (1984) derives a size of the radio emitting region of 60 pc, which includes all the massive stars we have identified.
Based on their radio data, Kennicutt (1984) estimates the number of Lyman continuum photons to be 1051.20 s-1 (adopting the distance of 14.1 kpc). When we scale this number to the currently most accurate distance of 11.1 kpc, the value decreases to 1050.99 s-1. The upper limit on the total number of ionizing photons emitted by our massive star sample is within an order of magnitude (1050.94 s-1).
High spatial resolution radio continuum observations of W49 (de Pree et al. 1997) resolve the large H ii region detected by Kennicutt (1984) and reveal the presence of many smaller H ii regions that are harbouring one or more O stars. After comparing the spatial locations of the O stars with those of the H ii regions, we could identify two H ii regions where we have found a central O star: #2 located in W49 South, and #8 associated with the radio shell source CC (de Pree et al. 1997). We recalculated the number of ionizing photons in the two H ii regions based on de Pree et al. (1997), and scaled to a distance of 11.1 kpc. The Lyman continuum photon flux derived from radio observations of W49 South and CC are 1049.73 s-1 and 1048.96 s-1, respectively.
As listed in Table 2, the O stars #2 and #8 emit 1050.03 ~ 50.27 s-1 and 1049.21 ~ 49.78 s-1 Lyman continuum photons, respectively. In both cases, the early O type stars provide sufficient Lyman continuum flux to completely ionize the local H ii region, which is consistent with the assumption that the stars are the main, if not the only, source of ionization in each region.
In W49, the luminosity output from massive stars dominates the feedback towards the cloud. In the current stage, neither over-pressurized ionized gas nor radiation pressure from the central cluster have cleared the entire molecular cloud. According to Galvan-Madrid et al. (2013), only 1% of the total gas mass (106 M⊙) is ionized. This agrees with simulations of cluster formation in massive molecular clouds (Dale et al. 2014). Consequently, a large number of photons must either be leaking out of W49 or must be absorbed by the dust still present in the region. Neither of these photons would contribute to the ionization of the nebula. We note that a large number of escaping ionizing photons is commonly observed in regions of massive star formation (Kurtz et al. 1994).
Smaller scale effects of feedback inside the molecular cloud, however, can be seen in W49. Figure 1 shows the presence of a nebular arc north of the central cluster. This arc appears to be part of a ring structure seen in Spitzer images, as well as CO line emission (Peng et al. 2010). Rings are likely to be the result of the feedback by stellar winds or ionizing photons of a few massive stars in W49.
5.3. Do massive stars in W49 form in isolation?
When looking at the spatial distribution of the massive stars (Fig. 1) and the H ii regions (also tracing the locations of the more embedded O stars) it becomes clear that several star formation sites are present in W49. In the near-infrared a central cluster (cluster 1) becomes evident which contains “only” 104 M⊙ within a radius of 45′′ (2.4 pc) (Homeier & Alves 2005), while the total mass of the 16 × 16 pc studied area is estimated to be 5–7 × 10⁴ M⊙. Apart from the clusters detected in the infrared, a proto-cluster is still forming and detected only at radio wavelength at a distance of about 3 pc distance from the centre of cluster 1. The so-called Welch ring (Welch et al. 1987) harbours dozens of strong radio continuum sources (de Pree et al. 1997), implying the presence of an even younger event of massive star formation.
The majority of the massive stars are concentrated towards cluster 1. Within a radius of 45′′ (2.4 pc), we identify ten OB stars and a massive YSO. Homeier & Alves (2005) used this radius to determine the total mass of cluster 1 to 104 M⊙. The four other stars are located in two of the subclusters identified by Alves & Homeier (2003): one star in cluster 2 near the H ii region W49 South and three stars in cluster 3 associated with H ii region CC.
The environments of the two YSOs differ from each other. One of them (#21) is in the subcluster to the north-west of the centre (shown with cyan circles in Fig. 1). The other YSO (#4) resides in the middle of the main cluster, thus showing that circumstellar disks can survive even in extreme environments with high stellar density and strong UV radiation field.
The distribution of the 11 massive stars in cluster 1 shows that not all massive stars are located in a compact cluster – unlike in NGC3603, where all the massive stars are within 1 pc of the centre (Moffat et al. 1994). Only six stars are within a projected distance less than 1 pc of the centre of cluster 1, while five stars are located outside, including #14 located at a projected distance of 2.2 pc. The Spitzer images obtained with the IRAC camera (Fazio et al. 2004) suggest there is a bow shock to the north of star #14 (Saral et al. 2015). This would indicate that #14 is a candidate run-away OB star, possibly orginating in the core of the central cluster (Gvaramadze et al. 2010). Assuming an age of 1 to 2 Myr (Sect. 4.1), we can calculate a projected velocity of 1 to 2 km s-1, which is required to reach 2.2 pc. This velocity is very low compared to the upper limit for OB runaway velocities of a few hundreds km s-1 (Philp et al. 1996). Considering that bowshocks typically appear around stars with velocities of >10 km s-1, star #14 might have been kicked out at a later state of the cluster’s lifetime.
Using the above argument, the massive stars associated with the W49 South and CC H ii regions might also be considered to be runaway stars from the central cluster. However, other arguments suggest that they might have formed there as members of a small sub-cluster. The stars are inside an H ii region, still surrounded by the molecular material where they might have formed. The shape of the W49 South H ii region (de Pree et al. 1997) is cometary, but directed towards the centre of cluster 1. The H ii region CC is classified as irregular, hence unlike a cometary shape created by the interaction of moving O stars with an H ii region. Additionally, Alves & Homeier (2003) show that small sub-clusters, consisting of more than one massive star, are associated with W49 South and CC.
Physical parameters of star-forming regions.
5.4. W49 as an extragalactic template?
The total gas mass within a radius of 60 pc and the stellar mass of W49 are estimated to be 1.1 × 10⁶ M⊙ (Galvan-Madrid et al. 2013) and 5–7 × 10⁴ M⊙ (Homeier & Alves 2005), respectively. This classifies W49 as one of the most massive star-forming regions in the Galaxy outside the Galactic centre, and makes it a template for extragalactic giant H ii regions, which have masses in the range Mgas = 104−107 M⊙ and Mstars = 103−105 M⊙ (Kennicutt 1984). W49 is reminiscent of the well-studied clusters NGC 3603 YC, W43, Westerlund 1 (Wd 1), Westerlund 2 (Wd 2), and the Carina Nebula complex (CNC). Their physical parameters are shown in comparison with W49’s in Table 3. The NGC 3603 YC (Rochau et al. 2010) is very compact in the centre and has ~40 high-mass O- and WR stars confined in a very compact region of ≤1 pc (Moffat et al. 1994). The stellar cluster of Wd2 reveals a morphology similar to NGC 3603 YC, but the former’s size is a few times larger and has a more extended scale. CNC consists of several dense clusters including Trumpler 14 and Trumpler 16, embedded in a large amount of gas and dust within the region extending over at least 80 pc (Preibisch et al. 2012). The central region of W49 with massive stars confined in a single dense core shows a similar morphology to NGC 3603 (Moffat et al. 1994), but its extent over more than 60 pc in diameter makes it less compact. Overall, the morphology of W49 is comparable to the Carina Nebula region, with some dense clusters embedded in a more distributed region of ongoing star formation, with the key difference being that CNC is closer to us, so can be studied at higher spatial resolution (Ascenso et al. 2007b).
The morphologies of star formation regions give us clues to their formation mechanisms. Different patterns of star formation exist among these regions. For NGC 3603, cloud-cloud collision might be the potential trigger of starburst (Fukui et al. 2014), and the resulting monolithic collapse could explain the formation of a ultra-compact core of NGC 3603. This is probably not the case for W49, where the star formation event seems to be taking place over a larger volume with individual subclusterings. Star formation in W49 might have been triggered by the density waves of a spiral arm forming a GMC, which subsequently via hierarchical fragmentation morphed into several cores of different mass and density, and finally resulting in cluster 1 and other subclusters in W49. For CNC, and very likely also for W49, star formation not only occurred in the core of the region, but also originated independently in multiple cores away from the centre. Several young clusters formed and exist simultaneously in the Carina Nebula star formation complex. For W49, with several sub-clusters outside of the main cluster, the formation process seems to not be strictly coeval. The presence of the Welch ring also indicates non-coeval star formation. Considering the comparable size of W49 and CNC, and the presence of multi-seed star formation sites in W49, CNC with its several compact clusters may represent a more evolved state of a W49-type starburst region.
6. Conclusions
In this paper we have presented JHK imaging (NTT/SOFI and LBT/LUCI) and K-band spectroscopy (LBT/LUCI) of the massive stellar content in W49, one of the most massive and young star-forming regions in our Galaxy located at a distance of 11.1 kpc from us. Our main findings are as follows.
-
1.
Our photometry confirms the high extinction (on average AKs ~ 3 mag) and large extinction variations. The presence of two infrared excess sources implies the existence of circumstellar disks around massive YSOs.
-
2.
Fourteen O-type stars and two stars with CO disks are identified according to their near-infrared spectra. With the derived spectral types, their physical parameters are estimated, including effective temperature and bolometric luminosities. With the magnitudes derived from photometry and by comparing with Geneva stellar evolution models, the masses and ages of the massive stars are estimated. The most massive star found in our survey is #2 with an upper mass limit of ~240 M⊙.
-
3.
The analysis of the stellar population enables us to study the properties of the cluster and the star formation region. Massive cluster members have a typical age of 1.5 Myr, while the presence of embedded sources indicates still ongoing star formation in the region. The number of massive stars is consistent with previous estimates of a cluster mass of 50 000 to 70 000 solar masses. The massive stars are also capable of providing the vast majority of the ionizing photons powering the H ii region. The spatial distribution of the massive stars indicates that some of the stars might have formed several half-mass radii away from the cluster centre, though ejection from the clusters is also a possibility.
-
4.
Considering its young age, abundant reservoir of gas, and high total mass, W49 is comparable to extragalactic giant H ii regions. It can serve as a template and help us to understand star formation in normal and starburst galaxies, which is poorly studied because of large distances.
The extreme crowding in the cluster centre and the incompleteness of our spectroscopic survey sample make a complete stellar census of W49 impossible for seeing limited angular resolution. This limits our ability to precisely reconstruct the formation history of W49. Higher angular resolution observations are required to achieve a comprehensive view of the formation of this young star cluster.
Acknowledgments
We thank the referee for helpful suggestions that improved the paper significantly. We acknowledge Boyke Rochau for carrying out part of the spectroscopic observations. We thank Nancy Ageorges and Walter Seifert for carrying out the K-band imaging observations. We thank Leisa Townsley and Patrick Broos for discussions of the X-ray sources in W49. A.B. acknowledges MPIA for hospitality and travel support. IRAF is distributed by the National Optical Astronomy Observatory, which is operated by the Association of Universities for Research in Astronomy, Inc., under cooperative agreement with the National Science Foundation
References
- Ageorges, N., Seifert, W., Jütte, M., et al. 2010, Proc. SPIE, 7735, 53 [NASA ADS] [Google Scholar]
- Alves, J., & Homeier, N. 2003, ApJ, 589, L45 [NASA ADS] [CrossRef] [Google Scholar]
- Ascenso, J., Alves, J., Beletsky, Y., & Lago, M. T. V. T. 2007a, A&A, 466, 137 [NASA ADS] [CrossRef] [EDP Sciences] [Google Scholar]
- Ascenso, J., Alves, J., Vicente, S., & Lago, M. T. V. T. 2007b, A&A, 476, 199 [NASA ADS] [CrossRef] [EDP Sciences] [Google Scholar]
- Bally, J., Anderson, L. D., Battersby, C., et al. 2010, A&A, 518, L90 [Google Scholar]
- Banerjee, S., Kroupa, P., & Oh, S. 2012, ApJ, 746, 15 [Google Scholar]
- Bestenlehner, J. M., Vink, J. S., Gräfener, G., et al. 2011, A&A, 530, L14 [NASA ADS] [CrossRef] [EDP Sciences] [Google Scholar]
- Bik, A., & Thi, W. F. 2004, A&A, 427, L13 [NASA ADS] [CrossRef] [EDP Sciences] [Google Scholar]
- Bik, A., Kaper, L., Hanson, M. M., & Smits, M. 2005, A&A, 440, 121 [NASA ADS] [CrossRef] [EDP Sciences] [Google Scholar]
- Bik, A., Kaper, L., & Waters, L. B. F. M. 2006, A&A, 455, 561 [NASA ADS] [CrossRef] [EDP Sciences] [Google Scholar]
- Bik, A., Henning, T., Stolte, A., et al. 2012, ApJ, 744, 87 [NASA ADS] [CrossRef] [Google Scholar]
- Bik, A., Stolte, A., Gennaro, M., et al. 2014, A&A, 561, A12 [Google Scholar]
- Blaauw, A. 1991, in NATO Advanced Science Institutes (ASI) Series C, 342, eds. C. J. Lada, & N. D. Kylafis, 125 [Google Scholar]
- Blum, R. D., Damineli, A., & Conti, P. S. 1999, AJ, 117, 1392 [NASA ADS] [CrossRef] [Google Scholar]
- Bonnell, I. A., Vine, S. G., & Bate, M. R. 2004, MNRAS, 349, 735 [NASA ADS] [CrossRef] [Google Scholar]
- Bouret, J.-C., Lanz, T., Hillier, D. J., et al. 2003, ApJ, 595, 1182 [NASA ADS] [CrossRef] [Google Scholar]
- Brandner, W., Clark, J. S., Stolte, A., et al. 2008, A&A, 478, 137 [NASA ADS] [CrossRef] [EDP Sciences] [Google Scholar]
- Bressert, E., Bastian, N., Evans, C. J., et al. 2012, A&A, 542, A49 [NASA ADS] [CrossRef] [EDP Sciences] [Google Scholar]
- Buschkamp, P., Hofmann, R., Gemperlein, H., et al. 2010, Proc. SPIE, 7735, 236 [NASA ADS] [Google Scholar]
- Chlebowski, T., Harnden, Jr., F. R. & Sciortino, S. 1989, ApJ, 341, 427 [NASA ADS] [CrossRef] [Google Scholar]
- Clark, J. S., Negueruela, I., Crowther, P. A., & Goodwin, S. P. 2005, A&A, 434, 949 [NASA ADS] [CrossRef] [EDP Sciences] [Google Scholar]
- Comerón, F., & Pasquali, A. 2012, A&A, 543, A101 [NASA ADS] [CrossRef] [EDP Sciences] [Google Scholar]
- Conti, P. S., & Blum, R. D. 2002, ApJ, 564, 827 [NASA ADS] [CrossRef] [Google Scholar]
- Crowther, P. A., Hadfield, L. J., Clark, J. S., Negueruela, I., & Vacca, W. D. 2006, MNRAS, 372, 1407 [NASA ADS] [CrossRef] [Google Scholar]
- Crowther, P. A., Schnurr, O., Hirschi, R., et al. 2010, MNRAS, 408, 731 [NASA ADS] [CrossRef] [Google Scholar]
- Crowther, P. A., & Walborn, N. R. 2011, MNRAS, 416, 1311 [NASA ADS] [CrossRef] [MathSciNet] [Google Scholar]
- Dale, J. E., Ngoumou, J., Ercolano, B., & Bonnell, I. A. 2013, MNRAS, 436, 3430 [NASA ADS] [CrossRef] [Google Scholar]
- Dale, J. E., Ngoumou, J., Ercolano, B., & Bonnell, I. A. 2014, MNRAS, 442, 694 [NASA ADS] [CrossRef] [MathSciNet] [Google Scholar]
- Davies, R. I. 2007, MNRAS, 375, 1099 [NASA ADS] [CrossRef] [Google Scholar]
- de Pree, C. G., Mehringer, D. M., & Goss, W. M. 1997, ApJ, 482, 307 [NASA ADS] [CrossRef] [Google Scholar]
- de Wit, W. J., Testi, L., Palla, F., & Zinnecker, H. 2005, A&A, 437, 247 [NASA ADS] [CrossRef] [EDP Sciences] [Google Scholar]
- de Zeeuw, P. T., Hoogerwerf, R., de Bruijne, J. H. J., Brown, A. G. A., & Blaauw, A. 1999, AJ, 117, 354 [NASA ADS] [CrossRef] [Google Scholar]
- Ekström, S., Georgy, C., Eggenberger, P., et al. 2012, A&A, 537, A146 [NASA ADS] [CrossRef] [EDP Sciences] [Google Scholar]
- Fang, M., van Boekel, R., King, R. R., et al. 2012, A&A, 539, A119 [NASA ADS] [CrossRef] [EDP Sciences] [Google Scholar]
- Fazio, G. G., Hora, J. L., Allen, L. E., et al. 2004, ApJS, 154, 10 [NASA ADS] [CrossRef] [Google Scholar]
- Figer, D. F. 2005, Nature, 434, 192 [NASA ADS] [CrossRef] [PubMed] [Google Scholar]
- Fitzpatrick, E. L. 1999, PASP, 111, 63 [NASA ADS] [CrossRef] [Google Scholar]
- Fukui, Y., Ohama, A., Hanaoka, N., et al. 2014, ApJ, 780, 36 [NASA ADS] [CrossRef] [Google Scholar]
- Galvan-Madrid, R., Liu, H. B., Zhang, Z.-Y., et al. 2013, ApJ, 779, 121 [NASA ADS] [CrossRef] [Google Scholar]
- Gennaro, M., Brandner, W., Stolte, A., & Henning, T. 2011, MNRAS, 412, 2469 [NASA ADS] [CrossRef] [MathSciNet] [Google Scholar]
- Grabelsky, D. A., Cohen, R. S., Bronfman, L., & Thaddeus, P. 1988, ApJ, 331, 181 [NASA ADS] [CrossRef] [Google Scholar]
- Gräfener, G., Vink, J. S., de Koter, A., & Langer, N. 2011, A&A, 535, A56 [NASA ADS] [CrossRef] [EDP Sciences] [Google Scholar]
- Gvaramadze, V. V., Kroupa, P., & Pflamm-Altenburg, J. 2010, A&A, 519, A33 [NASA ADS] [CrossRef] [EDP Sciences] [Google Scholar]
- Hanson, M. M., Conti, P. S., & Rieke, M. J. 1996, ApJS, 107, 281 [Google Scholar]
- Hanson, M. M., Kudritzki, R.-P., Kenworthy, M. A., Puls, J., & Tokunaga, A. T. 2005, ApJS, 161, 154 [NASA ADS] [CrossRef] [EDP Sciences] [MathSciNet] [Google Scholar]
- Hernández, J., Hartmann, L., Calvet, N., et al. 2008, ApJ, 686, 1195 [NASA ADS] [CrossRef] [Google Scholar]
- Hilditch, R. W., Howarth, I. D., & Harries, T. J. 2005, MNRAS, 357, 304 [NASA ADS] [CrossRef] [Google Scholar]
- Hill, J. M., Green, R. F., & Slagle, J. H. 2006, Proc. SPIE, 6267, 31 [NASA ADS] [Google Scholar]
- Hillier, D. J., & Miller, D. L. 1998, ApJ, 496, 407 [NASA ADS] [CrossRef] [Google Scholar]
- Hollenbach, D. J., Yorke, H. W., & Johnstone, D. 2000, Protostars and Planets IV, 401 [Google Scholar]
- Homeier, N. L., & Alves, J. 2005, A&A, 430, 481 [NASA ADS] [CrossRef] [EDP Sciences] [Google Scholar]
- Indebetouw, R., Mathis, J. S., Babler, B. L., et al. 2005, ApJ, 619, 931 [NASA ADS] [CrossRef] [Google Scholar]
- Johnston, K. G., Beuther, H., Linz, H., et al. 2014, A&A, 568, A56 [NASA ADS] [CrossRef] [EDP Sciences] [Google Scholar]
- Kennicutt, Jr., R. C. 1984, ApJ, 287, 116 [NASA ADS] [CrossRef] [Google Scholar]
- Koen, C. 2006, MNRAS, 365, 590 [NASA ADS] [CrossRef] [Google Scholar]
- Kroupa, P. 2001, MNRAS, 322, 231 [NASA ADS] [CrossRef] [Google Scholar]
- Kudryavtseva, N., Brandner, W., Gennaro, M., et al. 2012, ApJ, 750, L44 [NASA ADS] [CrossRef] [Google Scholar]
- Kurtz, S. E., Churchwell, E. B., & Wood, D. O. S. 1994, ApJS, 91, 659 [NASA ADS] [CrossRef] [Google Scholar]
- Lejeune, T., & Schaerer, D. 2001, A&A, 366, 538 [NASA ADS] [CrossRef] [EDP Sciences] [Google Scholar]
- Longmore, S. N., Kruijssen, J. M. D., Bastian, N., et al. 2014, Protostars and Planets VI, 291 [Google Scholar]
- Martins, F., & Plez, B. 2006, A&A, 457, 637 [NASA ADS] [CrossRef] [EDP Sciences] [Google Scholar]
- Martins, F., Schaerer, D., & Hillier, D. J. 2005, A&A, 436, 1049 [NASA ADS] [CrossRef] [EDP Sciences] [Google Scholar]
- McGregor, P. J., Hyland, A. R., & Hillier, D. J. 1988, ApJ, 324, 1071 [NASA ADS] [CrossRef] [Google Scholar]
- Moffat, A. F. J., Drissen, L., & Shara, M. M. 1994, ApJ, 436, 183 [NASA ADS] [CrossRef] [Google Scholar]
- Nagy, Z., van der Tak, F. F. S., Fuller, G. A., Spaans, M., & Plume, R. 2012, A&A, 542, A6 [NASA ADS] [CrossRef] [EDP Sciences] [Google Scholar]
- Nagy, Z., van der Tak, F. F. S., Fuller, G. A., & Plume, R. 2015, A&A, 577, A127 [NASA ADS] [CrossRef] [EDP Sciences] [Google Scholar]
- Nishiyama, S., Tamura, M., Hatano, H., et al. 2009, ApJ, 696, 1407 [NASA ADS] [CrossRef] [Google Scholar]
- Olczak, C., Pfalzner, S., & Eckart, A. 2010, A&A, 509, A63 [NASA ADS] [CrossRef] [EDP Sciences] [Google Scholar]
- Peng, T.-C., Wyrowski, F., van der Tak, F. F. S., Menten, K. M., & Walmsley, C. M. 2010, A&A, 520, A84 [NASA ADS] [CrossRef] [EDP Sciences] [Google Scholar]
- Philp, C. J., Evans, C. R., Leonard, P. J. T., & Frail, D. A. 1996, AJ, 111, 1220 [NASA ADS] [CrossRef] [Google Scholar]
- Preibisch, T., Roccatagliata, V., Gaczkowski, B., & Ratzka, T. 2012, A&A, 541, A132 [NASA ADS] [CrossRef] [EDP Sciences] [Google Scholar]
- Rieke, G. H., & Lebofsky, M. J. 1985, ApJ, 288, 618 [NASA ADS] [CrossRef] [Google Scholar]
- Roberts, H., van der Tak, F. F. S., Fuller, G. A., Plume, R., & Bayet, E. 2011, A&A, 525, A107 [NASA ADS] [CrossRef] [EDP Sciences] [Google Scholar]
- Rochau, B., Brandner, W., Stolte, A., et al. 2010, ApJ, 716, L90 [NASA ADS] [CrossRef] [Google Scholar]
- Sabbi, E., Sirianni, M., Nota, A., et al. 2008, AJ, 135, 173 [NASA ADS] [CrossRef] [Google Scholar]
- Salpeter, E. E. 1955, ApJ, 121, 161 [Google Scholar]
- Saral, G., Hora, J. L., Willis, S. E., et al. 2015, ApJ, 813, 25 [NASA ADS] [CrossRef] [Google Scholar]
- Seifert, W., Ageorges, N., Lehmitz, M., et al. 2010, Proc. SPIE, 7735, 256 [NASA ADS] [Google Scholar]
- Stevens, I. R., Blondin, J. M., & Pollock, A. M. T. 1992, ApJ, 386, 265 [NASA ADS] [CrossRef] [Google Scholar]
- Stolte, A., Brandner, W., Brandl, B., Zinnecker, H., & Grebel, E. K. 2004, AJ, 128, 765 [NASA ADS] [CrossRef] [Google Scholar]
- Stolte, A., Morris, M. R., Ghez, A. M., et al. 2010, ApJ, 718, 810 [NASA ADS] [CrossRef] [Google Scholar]
- Stolte, A., Hussmann, B., Olczak, C., et al. 2015, A&A, 578, A4 [NASA ADS] [CrossRef] [EDP Sciences] [Google Scholar]
- Vargas Álvarez, C. A., Kobulnicky, H. A., Bradley, D. R., et al. 2013, AJ, 145, 125 [NASA ADS] [CrossRef] [Google Scholar]
- Welch, W. J., Dreher, J. W., Jackson, J. M., Terebey, S., & Vogel, S. N. 1987, Science, 238, 1550 [NASA ADS] [CrossRef] [PubMed] [Google Scholar]
- Wheelwright, H. E., Oudmaijer, R. D., de Wit, W.-J., et al. 2010, MNRAS, 408, 1840 [NASA ADS] [CrossRef] [Google Scholar]
- Wu, S.-W., Bik, A., Henning, T., et al. 2014, A&A, 568, L13 [NASA ADS] [CrossRef] [EDP Sciences] [Google Scholar]
- Yusof, N., Hirschi, R., Meynet, G., et al. 2013, MNRAS, 433, 1114 [NASA ADS] [CrossRef] [Google Scholar]
- Zhang, B., Reid, M. J., Menten, K. M., et al. 2013, ApJ, 775, 79 [NASA ADS] [CrossRef] [Google Scholar]
- Zhang, B., Moscadelli, L., Sato, M., et al. 2014, ApJ, 781, 89 [NASA ADS] [CrossRef] [Google Scholar]
- Zinnecker, H., & Yorke, H. W. 2007, ARA&A, 45, 481 [NASA ADS] [CrossRef] [Google Scholar]
Appendix A: Observing log
Spectroscopically observed massive stars in W49.
Spectroscopically observed fore- and background stars.
All Tables
All Figures
|
Fig. 1 JHK composite colour image of the central 12 pc × 9 pc of W49. North is up, and east is to the left. The red, green, and blue channels are mapped to the K, H, and J, respectively. The J and H-band images are from NTT/SOFI, and the K-band image is from LBT/LUCI. The spectroscopically identified OB-type stars are marked by yellow squares. Two young stellar objects are marked with cyan circles. Two radio sources (W49 South and CC, also associated with subclusters) are labelled in white. |
| In the text | |
|
Fig. 2 H − K vs. K colour–magnitude diagram of W49. All sources identified in JHK, with errors less than 0.1 mag and with K ≤ 16 mag plotted in grey. The blue diamonds represent the spectroscopically identified OB stars, red triangles are the YSOs with CO emission in their spectra, while the green squares indicate the location of the stars with Brγ absorption lines as the most obvious feature, which cannot be classified due to a lack of other features (see discussion in the text). The purple circles are the 22 late type stars idenfied as fore- or background stars. The dashed vertical line represents the unreddened isochrone for main sequence stars with an age of 1 Myr (Ekström et al. 2012; Yusof et al. 2013). The black star symbols on the dashed vertical line mark the O stars with subtypes O3V to O5V with a step of 1, and O5V to O9.5V in steps of 0.5. The black stars in the bottom right mark the locations of O stars of different subtypes for AKs = 5 mag. The two diagonal dashed lines indicate the reddening directions of an O3V and O9.5V star according to the extinction law of Indebetouw et al. (2005). |
| In the text | |
|
Fig. 3 J − H, H − K colour–colour diagram of W49 for only the 22 sources discussed in the paper. The late type stars are not included here. The symbols have the same meaning as described in Fig. 2. The two black dashed lines represent main sequence isochrones with the age of 1 Myr, and the initial mass ranges from 0.8 to 500 M⊙ from Ekström et al. (2012) and Yusof et al. (2013) without being reddened (bottom left) and being reddened with AKs = 5 mag (upper right). The red diagonal line represents the reddening law according to Indebetouw et al. (2005). |
| In the text | |
|
Fig. 4 Normalized K-band spectrum of two stars identified as YSOs in W49. The most important features are the CO emission lines at the long wavelength end of their K-band spectra. |
| In the text | |
|
Fig. 5 Normalized K-band spectrum of OB type stars in W49 as taken with the multi-object mode of LUCI. The star number and the spectral type based on the spectroscopic classification are indicated above the corresponding spectrum. Indicated with dashed lines are the spectral features crucial for spectroscopic classification. |
| In the text | |
|
Fig. 6 Normalized K-band spectra of Of type stars in W49 as taken with the multi-object mode of LUCI. The star number and the spectral type from spectroscopic classification are labelled above the corresponding spectrum. Indicated with dashed lines are the spectral features crucial for classification. |
| In the text | |
|
Fig. 7 Hertzsprung-Russell diagram (HRD) of the massive stars in W49. The solid line represents the zero age main sequence isochrone from Lejeune & Schaerer (2001). The dashed lines are main-sequence isochrones for 1, 1.5, 2, and 3 Myr from Ekström et al. (2012) and Yusof et al. (2013). The stars are dereddened using the extinction law of Indebetouw et al. (2005). Three very massive stars are indicated by red dots, while OB main sequence stars are indicated by black dots. |
| In the text | |
|
Fig. 8 Hertzsprung-Russell diagram (HRD) of the massive stars in W49. The solid lines represent the evolutionary tracks from Ekström et al. (2012) and Yusof et al. (2013). See Fig. 7 for an explanation of the symbols. |
| In the text | |
Current usage metrics show cumulative count of Article Views (full-text article views including HTML views, PDF and ePub downloads, according to the available data) and Abstracts Views on Vision4Press platform.
Data correspond to usage on the plateform after 2015. The current usage metrics is available 48-96 hours after online publication and is updated daily on week days.
Initial download of the metrics may take a while.