| Issue |
A&A
Volume 589, May 2016
|
|
|---|---|---|
| Article Number | A59 | |
| Number of page(s) | 14 | |
| Section | Extragalactic astronomy | |
| DOI | https://doi.org/10.1051/0004-6361/201527689 | |
| Published online | 13 April 2016 | |
NuSTAR observations of water megamaser AGN
1
INAF–Osservatorio Astronomico di Bologna, via Ranzani 1,
40127
Bologna,
Italy
e-mail:
This email address is being protected from spambots. You need JavaScript enabled to view it.
2
Dipartimento di Fisica e Astronomia (DIFA), Università di
Bologna, viale Berti Pichat
6/2, 40127
Bologna,
Italy
3
Cahill Center for Astronomy and Astrophysics, California Institute
of Technology, Pasadena, CA
91125,
USA
4
New York University Abu Dhabi, PO Box 129188, Abu Dhabi, UAE
5
Center for Cosmology and Particle Physics, Department of Physics,
New York University – Affiliate Member, 4 Washington Place, New York, NY
10003,
USA
6
ASDC-ASI, via del Politecnico, 00133
Roma,
Italy
7
INAF–Osservatorio Astronomico di Roma, via Frascati
33, 00040
Monte Porzio Catone,
Italy
8
Center for Relativistic Astrophysics, School of Physics, Georgia
Institute of Technology, Atlanta, GA
30332,
USA
9
Instituto de Astrofísica, Facultad de Física, Pontificia
Universidad Católica de Chile, 306
Santiago 22,
Chile
10 Millennium Institute of Astrophysics, MAS, Nuncio Monseñor
Sótero Sanz 100, Providencia, Santiago de Chile
11
Space Science Institute, 4750 Walnut Street, Suite 205, Boulder, Colorado
80301,
USA
12
EMBIGGEN Anillo, Concepción, Chile
13
Space Science Laboratory, University of California,
Berkeley, CA
94720,
USA
14
Department of Astronomy and Astrophysics, 525 Davey Lab, The
Pennsylvania State University, University Park, PA
16802,
USA
15
Institute for Gravitation and the Cosmos, The Pennsylvania State
University, University
Park, PA
16802,
USA
16
Department of Physics, 104 Davey Lab, The Pennsylvania State
University, University
Park, PA
16802,
USA
17
DTU Space National Space Institute, Technical University of
Denmark, Elektrovej
327, 2800
Lyngby,
Denmark
18
Lawrence Livermore National Laboratory,
Livermore, CA
94550,
USA
19
Centre for Extragalactic Astronomy, Department of Physics,
University of Durham, South
Road, Durham
DH1 3LE,
UK
20
School of Physics and Astronomy, University of
Southampton, Highfield, Southampton
SO17 1BJ,
UK
21
Columbia Astrophysics Laboratory, Columbia
University, New York,
NY
10027,
USA
22
Institute for Astronomy, Department of Physics,
ETH Zurich, Wolfgang-Pauli-Strasse
27, 8093
Zurich,
Switzerland
23
Kavli Institute for Particle Astrophysics and Cosmology, SLAC
National Accelerator Laboratory, Menlo Park, CA
94025,
USA
24
Jet Propulsion Laboratory, California Institute of
Technology, Pasadena,
CA
91109,
USA
25
NASA Goddard Space Flight Center, Greenbelt, MD
20771,
USA
26 SNSF Ambizione Postdoctoral Fellow
Received: 3 November 2015
Accepted: 9 February 2016
Abstract
Aims. We study the connection between the masing disk and obscuring torus in Seyfert 2 galaxies.
Methods. We present a uniform X-ray spectral analysis of the high energy properties of 14 nearby megamaser active galactic nuclei observed by NuSTAR. We use a simple analytical model to localize the maser disk and understand its connection with the torus by combining NuSTAR spectral parameters with the available physical quantities from VLBI mapping.
Results. Most of the sources that we analyzed are heavily obscured, showing a column density in excess of ~1023 cm-2; in particular, 79% are Compton-thick (NH > 1.5 × 1024 cm-2). When using column densities measured by NuSTAR with the assumption that the torus is the extension of the maser disk, and further assuming a reasonable density profile, we can predict the torus dimensions. They are found to be consistent with mid-IR interferometry parsec-scale observations of Circinus and NGC 1068. In this picture, the maser disk is intimately connected to the inner part of the torus. It is probably made of a large number of molecular clouds that connect the torus and the outer part of the accretion disk, giving rise to a thin disk rotating in most cases in Keplerian or sub-Keplerian motion. This toy model explains the established close connection between water megamaser emission and nuclear obscuration as a geometric effect.
Key words: masers / galaxies: active / galaxies: Seyfert
© ESO, 2016
1. Introduction
There is strong evidence that a significant number of active galactic nuclei (AGN) are mildly or heavily obscured by a large amount of gas, preventing us from detecting their nuclear emission. The study of the column density distribution among Seyfert 2 galaxies (Risaliti et al. 1999) is a key element in understanding the nature and structure of the putative toroidal reprocessor of the AGN unified model (Antonucci 1993; Urry & Padovani 1995), which is responsible for many of the observed differences between type 1 and type 2 Seyfert galaxies. The most common way to study the innermost regions of obscured AGN is through their hard X-ray emission, which can penetrate even very high obscuring column densities.
The Nuclear Spectroscopic Telescope Array (NuSTAR) is a recent hard X-ray observatory launched in June 2012. It has two coaligned X-ray optics that focus X-ray photons onto two independent shielded focal plane modules (FPMs), namely FPMA and FPMB. Thanks to its focusing optics, it has a broad and high-quality spectral coverage from 3 keV to 79 keV, a field of view (FoV) at 10 keV of 10′× 10′, and an 18′′ FWHM with a half-power diameter of 58′′(Harrison et al. 2013). Given these features, NuSTAR is suitable for studying the hard X-ray spectra of AGN with high sensitivity, distinguishing between the transmitted nuclear emission (i.e., radiation that penetrates the obscuring matter along the line of sight) and the scattered or reflected component (i.e., radiation that interacts with circumnuclear gas and gets absorbed or Compton-scattered). One of the NuSTAR scientific goals is to study the Compton-thick (NH> 1.5 × 1024 cm-2) AGN population, which is still poorly understood owing to the lack of good quality spectra above 10 keV. This class of obscured active nuclei (see Comastri 2004, for a review) is predicted from population synthesis models of the X-ray background (Gilli et al. 2007; Treister et al. 2009) to be a non-negligible contributor to the ~30 keV peak of the cosmic X-ray background (CXB), which is still today mostly unresolved (Civano et al. 2015; Mullaney et al. 2015; Aird et al. 2015; Harrison et al. 2015).
The 22 GHz maser line emitted by water vapor molecules having the 616−523 rotational transition can pass through thick absorbing matter and probe the innermost part of the nuclear structure, where high density and near edge-on geometry are needed to produce maser amplification. It has been a long time since the first water vapor extragalactic maser emission was discovered in M33 (Churchwell et al. 1977). Today, nearly 200 galaxies have been detected in H2O maser emission, some associated with disk structures, jets or outflows (e.g., see Table 1 of Lo 2005). Because of their high luminosities with respect to Galactic masers, extragalactic water masers associated to AGN are generally called megamasers, while those associated to star-forming regions are sometimes referred to as kilomasers.
Very long baseline interferometry (VLBI) radio observations provide a robust tool for studying subparsec structures. In particular, in disk maser systems, precise estimates of the central dynamical mass can be performed. VLBI maser mapping has been used to test the existence of supermassive black holes (SMBHs), ruling out other candidates (such as rich clusters of stars), and to measure distances independently of a cosmological model (see, e.g., Reid et al. 2009, 2013). Notably, megamasers tend to be found in Seyfert 2 (Sy2) galaxies and, in particular, in Compton-thick ones (Greenhill et al. 2008), which according to the AGN unification scheme, are likely to be those where the obscuring structure is seen nearly edge-on.
High-quality hard X-ray (>10 keV) data coupled with high-resolution radio maps of the nuclear emission allow new studies of the physics of obscured AGN. Some previous work concentrated on the connection between masing activity and high obscuring column densities in active nuclei, identifying some general and phenomenological results (Greenhill et al. 2008; Castangia et al. 2013). However, many questions are still unanswered. Physical conditions, such as the temperature, density, and pressure of matter in the vicinity of the SMBH, are still uncertain. It is not completely clear whether the maser emission is associated with the outer part of the accretion disk or if it is part of the toroidal structure obscuring the nucleus along our line of sight. In this paper we first present new spectral analyses of NuSTAR observations of megamaser sources, using a sample of local AGN with good quality X-ray data and radio maps. We then combine the information from the hard X-ray and radio bands to derive a physical picture of the complex environment in which SMBHs are growing.
The paper is organized as follows. In Sect. 2 we present the megamaser sample and the X-ray analyses with a brief explanation of modeling and some notes on individual sources. Section 3 presents results we obtained by combining the spectral and maser disk parameters with a toy model. A discussion of the toy model is given in Sect. 4. We give a summary in Sect. 5.
Megamaser sample, global properties, and references.
2. Data and spectral analysis
2.1. The sample
To build up a sample of disk megamaser sources with high-quality maser maps, precise black hole mass estimates, and hard X-ray spectral coverage, we cross-correlated a list of VLBI-mapped water megamasers from the Megamaser Cosmology Project1 (MCP, see Henkel et al. 2012) with NuSTAR observations and well known disk maser sources studied in the literature. We found 11 objects. We then enlarged the sample by adding three more sources with VLBI radio maps available, but lacking NuSTAR data (refer to Castangia et al. 2013, for X-ray and maser disk properties of these). The total sample is then composed of 14 sources, which are all the disk water megamasers known today with both precise VLBI maps and hard X-ray spectra. Their main properties are listed in Table 1. However, we emphasize that this is not a complete sample of all the water megamasers known today, which can be found in Pesce et al. (2015).
2.2. Data reduction
We present NuSTAR hard X-ray spectral results for 11 sources. In particular, we use archival data for NGC 1194, NGC 1386, NGC 2273, NGC 2960, NGC 3079, NGC 3393, NGC 4388, and IC 2560, for which observation dates and exposure times can be found in Table 2. For NGC 4945, NGC 1068, and the Circinus galaxy, spectral parameters are taken from Puccetti et al. (2014), Bauer et al. (2015), and Arévalo et al. (2014), respectively.
The raw events files were processed using the NuSTAR Data Analysis Software package v. 1.4.1 (NuSTARDAS)2. Calibrated and cleaned event files were produced using the calibration files in the NuSTAR CALDB (20150225) and standard filtering criteria with the nupipeline task. We used the nuproducts task included in the NuSTARDAS package to extract the NuSTAR source and background spectra using the appropriate response and ancillary files. We extracted spectra and light curves in each focal plane module using circular apertures of different radii, aimed at optimizing the signal-to-noise ratio at high energies for every source (see Baloković et al., in prep., for further details). Background spectra were extracted using source-free regions on the same detector as the source. All spectra were binned to a minimum of 20 photons per bin using the HEAsoft task grppha.
2.3. Spectral analysis
The spectral analysis was carried out using the XSPEC software (Arnaud 1996). We started by fitting the spectra with simple power law models for an initial visual inspection of the broadband spectral curvature and X-ray absorption. We then applied phenomenological models, such as plcabs (Yaqoob 1997) or pexrav (Magdziarz & Zdziarski 1995), to model the hard X-ray continua. The former describes X-ray transmission of an intrinsic power law with an exponential cutoff through an obscuring medium, taking the effects of Compton scattering into account. The latter models Compton reflection on a slab of neutral material with infinite optical depth.
It was always possible to find a combination of these two models that gave an excellent fit to the data. However, as pointed out by Murphy & Yaqoob (2009), using plcabs and pexrav may produce a bias toward fits dominated by the direct continuum. These initial results, then, need to be tested against more self-consistent and physically motivated models based on Monte Carlo simulations, such as MYTorus (Murphy & Yaqoob 2009) and Torus (Brightman & Nandra 2011). They both model the hard X-ray spectrum emitted through a toroidal reprocessor, consisting of a transmitted continuum (photons passing through the torus without interacting), a scattered or reflected component that is made up of photons that interact with matter via Compton scattering, and emission lines (mostly iron Kα and Kβ). MYTorus allows a dynamic decoupling of these three components to simulate different geometries. It can be used in the default configuration (“MYTorus coupled”), modeling a classical “donut-shaped” toroidal reprocessor with a fixed covering factor of 0.5 (i.e., the half-opening angle θtor of the torus is 60°, measured as the angle between the axis of the system and the edge of the torus itself), or in a more complex way, called “MYTorus decoupled”.
In this configuration, part of the reflection from the inner far side of the reprocessor could be unobscured by material on the near side of it. In this case, the far-side reflection, at least below ~10 keV, can dominate the observed spectrum. This back-reflected continuum and the associated lines are parameterized with a MYTorus face-on reflection spectrum, obtained by fixing the inclination angle of the system θobs to 0°. On the other hand, the forward-scattered emission and associated emission lines are approximated using a MYTorus edge-on reflection spectrum, obtained by fixing θobs to 90°. The relative strength of these two components (front and back-scattered) is encoded in two constants, namely AS90 and AS00, which are left free to vary. Their respective line components for this geometry are normalized with AL90 and AL00. Finally, in the most general case, the column density NH obscuring the direct continuum can be decoupled from the column density responsible for the back reflection or the forward reflection or both. A single NH value is adopted for the sake of simplicity. We refer to Yaqoob (2012) for an exhaustive example of the use of the model in its decoupled mode. The Torus model does not decouple the three components, but has the opening angle as a free parameter, allowing the measurement of the covering factor (see Brightman et al. 2015). In the following, we always assume a nearly edge-on inclination of the reprocessor (i.e., we fix the inclination angle of the system, θobs, to 90°), even if the toroidal geometry is slightly different between the two models.
We first apply all these physical models alone, then we concentrate on the best among them and refine it adding other line features, if needed, or another power law. The last is usually significant at lower energies (below ~5 keV) and is thought to be due to electron scattering in an ionized zone extended on a size scale larger than the obscuring structure, even if its contribution depends on modeling details. To model this physical situation in a simple manner, we tied all the power law parameters to the primary one (i.e., photon index, redshift, normalization) and multiplied it by a constant, namely fs, which is a free parameter in the fit that quantifies the fraction of the primary power law scattered at low energies. We refer to this power law as a “scattered power law”. We explain in detail the general fitting procedure for NGC 1194, while for the remaining eight sources we summarize the most relevant findings, in particular the most precise measurement of the column density available to date. Errors quoted always refer to 90% confidence limits for one interesting parameter, if not stated otherwise.
NuSTAR observation details for the eight sources analyzed.
2.3.1. NGC 1194
NGC 1194 is a nearby Seyfert 1.9 galaxy. It hosts a circumnuclear maser disk, which allowed a precise measurement of the BH mass of (6.5 ± 0.3) × 107M⊙(Kuo et al. 2011). Fitting the spectrum with an absorbed power law using a Galactic column returns an uncharacteristically hard photon index (Γ ~ 0.5) and leaves large residuals, in particular a prominent line feature at ~6−7 keV and an excess between 10 and 30 keV (χ2/ν = 494 / 117). These are typical spectral signatures of an obscured AGN. A plcabs model (which accounts for obscuration) with two intrinsically narrow (σ = 10 eV) Gaussian components for the lines at 6−7 keV returns a much better fit (χ2/ν = 186 / 112). The obscuration is in the Compton-thin regime (NH ~ 6 × 1023 cm-2), and the photon index is ~1. The residuals still show a hump at ~20 keV and signatures of soft excess at energies <5 keV. A better fit is obtained if plcabs is replaced by a pexrav model (χ2/ν = 96 / 113, Γ ~ 1.6). Using both models returns an even better fit with Γ ~ 1.6 and NH ~ 1024 cm-2 (χ2/ν = 85 / 111), in which the plcabs component is still significant at more than 99% confidence limit. This appears to be an unphysical situation, since the flux in the reflected component is much greater than the total intrinsic flux of the source.
We then apply more physically self-consistent models. An almost edge-on Torus model with a fixed opening angle (θtor = 60°) returns an unacceptable fit (χ2/ν = 220 / 116), with Γ ~ 1.4 and NH ~ 7 × 1023 cm-2. The fit can be improved by fitting for the torus opening angle (χ2/ν = 201 / 116), which has a best fit value of θtor = 26° (the lower limit accepted by the model) with Γ ~ 1.4 and NH ~ 6 × 1023 cm-2. A MYTorus model in its default configuration (i.e., coupled mode) returns a similar fit to the Torus one: χ2/ν = 217 / 116, Γ ~ 1.4 and NH ~ 6 × 1023 cm-2. A common feature of these models is the underprediction of both the flux of the line component at 6−7 keV (see, e.g., Vasylenko et al. 2015) and the emission below 5 keV. A MYTorus model in its decoupled mode is then applied (χ2/ν = 161/115). The front-scattered component vanishes, the photon index is ~1.6, and the column density is ~1024 cm-2. These values are consistent with what is found by applying phenomenological models in the first part of the analysis. We note that scattering ~3% of the primary continuum into a scattered power law and adding a line feature at (6.8 ± 0.1) keV do not change the fundamental fit parameters, but improve it at more than 99% confidence limit (χ2/ν = 113/112, Δχ2/Δν = 48 / 3). Even if the best fit model is made up of a combination of plcabs, pexrav, and zgauss models (χ2/ν = 85 / 111), we choose to rely on the best fit among the self-consistent ones, as for the other sources, which is the decoupled MYTorus model (see Fig. 1a).
In summary, given that phenomenological models point toward a highly obscured, reflection-dominated source and that the best fit in a physical and self-consistent model is represented by a back-scattered radiation-dominated MYTorus model, we conclude that NGC 1194 is a Compton-thick AGN with the column density  cm-2, consistent with the one reported by Greenhill et al. (2008). We note that, according to the best fit model, reflection only dominates below ~10 keV. Best fit spectral parameters are given in Table 3.
NuSTAR X-ray best fit spectral results for the eight sources analyzed (see text).
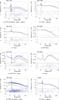 |
Fig. 1 NuSTAR spectra, best-fitting models and residuals for the eight sources analyzed. FPMA data are shown in black, while FPMB ones are shown in blue. When adopting a MYTorus model, the solid line represents the primary continuum. The reflection and line components are shown as the dashed line, while the scattered power law is shown as the dotted line. When adopting the Torus model, the solid line represents the total spectrum, while add-on line components are shown as the dashed line. |
2.3.2. NGC 1386
NGC 1386 hosts a water maser source (Braatz et al. 1997), although it is not clear whether the maser spots trace a rotating thin disk or align in front of an underlying continuum (i.e., are jet masers). This makes the central black hole mass estimate challenging so we adopted the one reported by McConnell & Ma (2013)3, which is 1.2 . A default MYTorus model fails (χ2/ν = 131/27), and two statistically indistinguishable sets of parameters are possible: one with a Compton-thin obscuration (NH ~ 6 × 1023 cm-2) and Γ ~ 1.4, and one with a severely obscured AGN (NH ~ 1025 cm-2) and Γ ~ 2.6. A decoupled MYTorus model points toward a back-scattered radiation-dominated spectrum with the same parameters as for the coupled case (χ2/ν = 65 / 25). The unacceptable fit (χ2/ν = 57 / 27) of the Torus model arises from an underestimation of the line contribution and provides the best χ2 among the physical models. Following Brightman et al. (2015), we added a line component to the fit at (6.5 ± 0.1) keV and get χ2/ν = 32 / 25. A scattered power law is not required by the data (Fig. 1b). The central source is then obscured by Compton-thick material of column density NH = (5 ± 1) × 1024 cm-2. Best fit parameters are given in Table 3. We note that our results agree with Brightman et al. (2015), where they focused on the Torus model for a covering factor estimate.
2.3.3. NGC 2273
The mass of the SMBH nested in the barred spiral galaxy NGC 2273 was measured by Kuo et al. (2011) to be MBH = (7.5 ± 0.4) × 106 M⊙. The reported parameters put the maser disk very close to the central engine (0.028−0.084 pc). This makes NGC 2273 an outlier in some relations (Castangia et al. 2013). To determine whether it is truly an outlier or whether emission at larger radii is missed by the VLBI observations, we derived radii from the more sensitive single-dish spectra taken with the Green Bank Telescope (Kuo et al. 2011). To do so, we assumed a systemic velocity of 1840 km s-1 (from NED4), a SMBH mass of 7.5 × 10⁶ M⊙(Kuo et al. 2011), and Keplerian rotation (Kuo et al. 2011). From the highest and lowest velocity emission (we require the emission to be at least 5 times the rms) of the high-velocity maser features, we find that the innermost radius is ~0.034 pc, consistent with Kuo et al. (2011), but that the outermost radius is ~0.2 pc. We adopt these values in the following analysis.
A MYTorus model cannot account for the line emission, and it gives an unacceptable fit (χ2/ν = 267 / 113). Its decoupled mode provides an acceptable fit (χ2/ν = 131 / 111), pointing toward a back-scattered, reflection-dominated AGN. However, the best fit is found with the Torus model, where the source is heavily Compton-thick and a lower limit on the column density is found (NH> 7.3 × 1024 cm-2), consistently with Guainazzi et al. (2005) and Awaki et al. (2009). Torus spectral parameters are found in Table 3, while the best fit model is shown in Fig. 1c.
2.3.4. NGC 2960
The central black hole mass of the spiral megamaser galaxy NGC 2960 (Mrk 1419) as reported by Kuo et al. (2011) is (1.16 ± 0.05) × 107 M⊙. NGC 2960 is very faint, and a 21 ks NuSTAR snapshot resulted in poor quality data that prevented us from significantly constraining spectral parameters. The fitting procedure in XSPEC was carried out using the Cash statistic (Cash 1979), but we report the reduced χ2 for direct comparison with other sources. Using a default MYTorus model and fixing the photon index Γ = 1.9 (Fig. 1d), the fit returns an obscured, but Compton-thin, source ( cm-2), which is marginally consistent with Greenhill et al. (2008). Results are listed in Table 3.
2.3.5. NGC 3079
The low ionization nuclear emission-line region (LINER) galaxy NGC 3079 presents a thick, flared, probably star-forming and self-gravitating maser disk (Kondratko et al. 2005). The disk’s outer radius is indeed beyond the sphere of influence radius of the central mass, which is 2.4 (McConnell & Ma 2013). Either Torus (χ2/ν = 193 / 152) or MYTorus (χ2/ν = 189 / 152), both with a scattered power law dominating below 5 keV, give similar results. Using a decoupled MYTorus model (χ2/ν = 189 / 150), the back-scattered contribution vanishes, confirming that the source is dominated by reflection below 10 keV. We therefore chose the coupled MYTorus model as the best fit (Fig. 1e) and conclude that NGC 3079 is transmission-dominated with a column density of NH = (2.5 ± 0.3) × 1024 cm-2 (see Table 3 for other parameters). This result agrees with the one found by Brightman et al. (2015) using the Torus model.
2.3.6. NGC 3393
The nearby barred galaxy NGC 3393 presents an edge-on maser disk that allowed Kondratko et al. (2008) to measure the central mass to be (3.1 ± 0.2) × 107 M⊙. An excellent fit is found with a Torus model (χ2/ν = 49 / 69), with parameters reported in Table 3. This fit is formally indistinguishable from a MYTorus model with a scattered power law in the soft part of the spectrum, either coupled or decoupled (χ2/ν = 49 / 69 and χ2/ν = 48 / 67, respectively), but we chose Torus as the best fit because it only requires one component (i.e., the scattered power law is not significant, see Fig. 1f). However, the spectral parameters are the same within the uncertainties. We therefore conclude that NGC 3393 hosts a Compton-thick AGN ( cm-2), in agreement with the results of Koss et al. (2015).
2.3.7. NGC 4388
The Virgo cluster member NGC 4388 hosts an active SMBH of mass (8.5 ± 0.2) × 106M⊙(Kuo et al. 2011). In their paper, Kuo et al. (2011) suggest using this mass value with caution because of the lack of systemic maser activity and the inability to robustly assess the Keplerian motion of the maser spots. Among the self-consistent models (Torus, MYTorus coupled, MYTorus decoupled) the last gives the best χ2, although spectral parameters are consistent among them all. A Torus model points toward smaller opening angles (i.e., larger covering factor, ~0.9), which could account for the line emission (χ2/ν = 761 / 684). Fitting with MYTorus in coupled mode underestimates the line feature (χ2/ν = 803 / 684). This could be due to supersolar iron abundance, a broad range of NH with different covering factors, or to a covering factor greater than that of the model, as suggested by the Torus model. Decoupling MYTorus does not change the general results, while the back-scattered radiation seems to be favored over the vanishing front-scattered one (χ2/ν = 729 / 682). The fit can be improved by adding a scattered power law below 5 keV, which brings the reduced chi-squared to χ2/ν = 693 / 681 (Fig. 1g). According to the best fit model, NGC 4388 is a Compton-thin (NH = 4.2 ± 0.5 × 1023 cm-2) transmission-dominated source, and our results agree with the constraints implied by its known hard X-ray variability on scales of days (Caballero-Garcia et al. 2012) and months (Fedorova et al. 2011). The MYTorus best fit parameters are reported in Table 3.
2.3.8. IC 2560
The barred spiral galaxy IC 2560 hosts a (3.5 ± 0.5) × 106 M⊙ active SMBH surrounded by a thin molecular maser disk (Yamauchi et al. 2012) with uncertain geometry (Tilak et al. 2008). The hard X-ray spectrum is well known from previous studies to be reflection-dominated (Baloković et al. 2014; Brightman et al. 2015). A default MYTorus model cannot reproduce a reflection-dominated spectrum (χ2/ν = 364/107). A decoupled version of this model does better (χ2/ν = 194 / 105), where all the radiation is back-scattered by Compton-thick material. The best fit is obtained with the Torus model (χ2/ν = 172/107), and adding a line component at (6.49 ± 0.06) keV significantly improves the fit (χ2/ν = 127 / 105, Fig. 1h). The column density is found to be > 6.7 × 1024 cm-2. Best fit parameters are given in Table 3 and agree with previous results in the literature.
2.4. Summary of spectral analysis results
In this section we presented hard X-ray spectral analyses for eight of the megamaser sources observed by NuSTAR. Three quarters turn out to be Compton-thick, while one quarter are Compton-thin. Among the latter, NGC 2960 is a 3σ detection in the NuSTAR snapshot, while NGC 4388 is a well known variable source, presenting column density variability on the scale of days.
Moreover, we note that out of seven sources showing a line feature (we exclude NGC 2960 in this argument, because of its weak detection), two do not have their line component well fit by self-consistent models (Torus or MYTorus). In both cases (NGC 1386 and IC 2560), the line was underestimated by the models. Finally, we note that using a decoupled MYTorus model in the Compton-thin regime (such as in the case of NGC 4388) should be done with caution, since the scattered components could mimic the transmitted primary continuum.
However, in this paper we are primarily interested in a robust estimate of the absorption column density, rather than an exhaustive discussion of the spectral properties of individual sources, which will be presented elsewhere (Baloković et al., in prep.). As previously stated, the final sample is completed by adding three NuSTAR-observed well known megamasers (NGC 4945, NGC 1068, Circinus), and three other maser disk AGN whose X-ray (XMM-Newton based) and maser disk parameters are taken from Castangia et al. (2013). Summarizing, the fraction of Compton-thick AGN in our final sample of local disk megamasers is at least ~79% (11/14), comparable to the values reported in previous studies (76% – Greenhill et al. 2008; 86% – Castangia et al. 2013) and confirming the tight relation between heavy obscuration and disk maser emission.
3. The connection between the maser disk and the torus
The aim of this paper is to deepen our understanding of the connection between the torus (seen as the X-ray obscurer) and the maser disk (i.e., an ensemble of clouds orbiting the central black hole, showing water maser activity). First, we can localize the disk. The maser emission occurs too far from the central black hole (in our sample, inner maser radii range from 6.6 × 10⁴ to 7.6 × 10⁶ gravitational radii) to identify the maser disk with the standard accretion disk, which extends up to ~103 gravitational radii (Netzer 2013, see Sect. 7.6, pp. 213−216). Moreover, the presence of water molecules requires the environment to be dusty. We then expect that the maser disk lies outside the dust sublimation radius Rd, which identifies the torus inner wall within the standard AGN framework (see, e.g., Netzer 2015). We used the relation from Gandhi et al. (2009) to calculate Rd for our sample, adopting a sublimation temperature of 1500 K for graphite grains with an average radial size of 0.05 μm (Barvainis 1987; Kishimoto et al. 2007). As expected, comparing Rd with the inner maser radius Rin and considering the uncertainties, all the sources have the maser disk within the dusty zone (i.e., Rin ≥ Rd), except NGC 2273 (as already pointed out by Castangia et al. 2013).
The maser disk can then be generally considered part of the torus with two different possible geometries: one in which the maser disk is the inner, sub-parsec scale part of the equatorial plane of the classical torus, as in Fig. 2a; and one in which the masing clouds are tracing a real geometrically thin disk that then inflates into a geometrically thicker end, required to have a large covering factor, as shown in Fig. 2b.
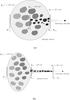 |
Fig. 2 Sketches of the two possible geometries for the location of the maser disk inside the torus. Sizes are not to scale, and the sketches are just meant to display the different possible locations of the maser disk. a) The disk is part of the equatorial plane of the torus. b) The disk inflates in its outer part, giving rise to a geometrically thicker structure. The change from the inner part to the outer one is not abrupt and occurs with a gradual change in the dimensions and physical conditions of the clumps, encoded in the same density profile. |
There are many cases in which the maser disk is seen to be warped (NGC 2273, NGC 2960, Kuo et al. 2011; NGC 4258, Herrnstein et al. 2005; NGC 6264, Kuo et al. 2011; Circinus, Greenhill et al. 2003), or inflating in its outer part (NGC 3079, Kondratko et al. 2005). In particular, in the case of Circinus, the warp is consistent with channeling the nuclear outflow.
These geometries are difficult to explain within the framework of Fig. 2a. Moreover, the basic model of astrophysical maser emission theory predicts that the disk should be directly irradiated by X-rays coming from the central source (Neufeld et al. 1994). Again, this makes it difficult to explain the emerging disk when considering a geometry like Fig. 2a. Finally, a steep density gradient in the vertical direction would be needed to only see edge-on maser emission; otherwise, maser disks would be ubiquitous among Sy2 galaxies, contrary to observations (Zhu et al. 2011). Here we do not have information on the torus vertical structure, but we can exploit the physical properties of the maser emission to infer something about the most likely geometry. High densities, nearly edge-on geometry, and a temperature range of ~400−1000 K are needed to have maser amplification (Lo 2005).
In this work, we concentrate only on the density condition. It is indeed difficult to estimate the temperature of the masing gas that is not, by definition, in thermodynamic equilibrium. Instead, we can estimate the density of the masing region, defining the maser disk radial extent ΔR = Rout − Rin, where Rout and Rin are the outer and inner radii of the maser disk. They are taken as the locations of the less red/blueshifted and most red/blueshifted maser spots with respect to the systemic velocity of the galaxy, if using the spectrum, or the innermost and outermost spots whether from systemic or red/blueshifted masers, if using the maps. With the disk extent and the column density measured from the X-rays, NH, we have a rough estimate of the mean density of the material along the line of sight: ![Mathematical equation: \begin{equation} \label{eq:rho} \rho = \frac{N_{\rm H}}{\Delta R} ~ [\text{cm}^{-3}], \end{equation}](/articles/aa/full_html/2016/05/aa27689-15/aa27689-15-eq146.png) (1)which we can compare with the densities predicted by astrophysical maser theory, 107<ρ< 1011 cm-3(Lo 2005; Tarchi 2012).
(1)which we can compare with the densities predicted by astrophysical maser theory, 107<ρ< 1011 cm-3(Lo 2005; Tarchi 2012).
Looking at the density distribution in our sample, it is clear that densities obtained with (1)are too low by at least one order of magnitude. This is a hint that using (1)and identifying the absorbing medium with the maser disk is not completely appropriate, and if so, all megamaser sources in the sample should be severely obscured. Indeed, with an average density of 109 cm-3 in a fraction of a parsec, the column density of such a maser disk should be on the order of 1026 cm-2. This is clearly not the case, because 3 out of 14 sources are Compton-thin (i.e., NH< 1.5 × 1024 cm-2), and 6 out of 14 are Compton-thick with NH< 1025 cm-2.
In general, the maser disk alone cannot replace the standard torus of the AGN unified model: it is too geometrically thin (otherwise nearly every Sy2 would be identified as a maser source, while nuclear water maser emission detection frequency is low, ~3%, Zhu et al. 2011) and too optically thick. There could be cases, however, in which a warped disk could simultaneously provide enough obscuration and low covering factor. We discuss this possibility in Sect. 4.3. Indeed, five sources of the sample present a lower limit on the column density and are therefore consistent with the absorber being the maser disk itself, seen exactly edge-on. Because the density increases overall, approaching the black hole, we may simply guess that the maser spots are detected in a high-density region in the inner part of the torus. Moreover, we can explain the tight relation between high obscuration and edge-on maser emission as a co-alignment between the maser clouds and the obscuring matter. In what follows, we then assume geometric alignment and continuity in the radial density profile between the maser disk and the inflated part of the torus, adopting a geometry as in Fig. 2b.
An alternative view of the result obtained with Eq. (1)involves clumpiness, which is addressed quite well by theoretical models. Models like the one by Elitzur & Shlosman (2006) study the interplay between the maser disk and the obscuring medium, followed by subsequent relevant work on this topic (e.g., Nenkova et al. 2008a,b). Dusty and molecular clouds orbiting the central engine are expected to have column densities in the range NH ~ 1022−1023 cm-2, and a few clouds are able to provide the necessary obscuration measured with X-ray spectroscopy, together with rapid variability and the radiation reprocessing in the infrared band. Even if many questions are still unanswered, these works point toward the importance of considering a clumpy medium, rather than a smooth one, to interpret and explain many properties of AGN. In this paper, we use analytical expressions of average quantities, like the density, to get our results. Later on, we test whether this methodology is too simplistic or not.
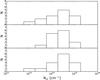 |
Fig. 3 Top panel: distribution of NH as measured by X-ray spectral fitting. Middle panel: distribution of column densities predicted by the model, using a power law density profile. Bottom panel: distribution of column densities predicted by the model, with mixed exponential density profile (see text). |
3.1. A toy model
Suppose now that the inner and outer radii of the maser disk correspond to the theoretically expected upper and lower limits in density suitable to have maser emission, respectively, and assume a power law for the density profile, such as  (2)where α is the power law index, which can be estimated for every source taking ρin = 1011 cm-3 and ρout = 107 cm-3:
  (3)Once we have recovered the power law index for each source using the maser disk sizes from Table 1, a continuity assumption in the radial density profile between the maser disk and the external part of the torus allows us to estimate the torus outer radius. Identifying the outer end of the maser disk with the beginning of the inflated end and keeping the same α, the torus outer radius
  will be the distance at which the density falls to, say, 104 cm-3 (see Netzer 2013, Sect. 7.5, p. 205). This value has a negligible effect on results, as we show in the following:
  (4)Assuming a density profile continuity between the maser disk and the external part of the torus, with this simple toy model one can recover the torus size, and then integrate its density along the line of sight inside the inflated part alone, to recover the column density:
 ![Mathematical equation: \begin{equation} \label{eq:postnh} N_{\rm H} = \int_{R_{\rm out}}^{R_{\rm out}^{\rm T}}{\rho(r){\rm d}r} = \frac{\rho_{\rm out}R_{\rm out}}{\alpha -1} \left[ 1 - \left(\frac{R_{\rm out}^{\rm T}}{R_{\rm out}}\right)^{1-\alpha}\right]\cdot \end{equation}](/articles/aa/full_html/2016/05/aa27689-15/aa27689-15-eq161.png) (5)Very interestingly, column densities calculated with (5)are in good agreement with the ones measured with X-ray spectral fitting (Fig. 3, middle panel). Moreover, it turns out that between the tunable parameters of the model (the densities ρin and ρout at which the maser disk begins and ends, and
(5)Very interestingly, column densities calculated with (5)are in good agreement with the ones measured with X-ray spectral fitting (Fig. 3, middle panel). Moreover, it turns out that between the tunable parameters of the model (the densities ρin and ρout at which the maser disk begins and ends, and  at which the torus ends), results are only sensitive to the outer maser disk density, ρout. This can be seen directly from Eq. (5). In particular, changing ρout by one order of magnitude changes NH by a factor ~14, while the same variation in ρin and has a negligible impact on the distribution (factor ~1.3 and ~1.01, respectively). In other words, a small change in the parameter ρout gives a large change in the recovered NH, and this is a hint that the theoretically driven choice of the three densities is the best at reproducing the observed column density distribution.
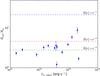 |
Fig. 4 Ratio of outer and inner maser radii for the sources in the sample as a function of X-ray (deabsorbed) luminosity in the 2−10 keV band. The trend N(r) ~ r-1 (blue dashed line) seems to be ruled out, while N(r) ~ r-2 and N(r) ~ r-3 (red and green dashed lines, respectively) are preferred. We note that the ratios expected for different clouds distributions depend on the critical maser densities assumed, being the expected ratio for a particular q, Rout/Rin = 10log (ρin/ρout) / 3q. |
Another step forward can be made by testing the power law assumption for the density profile. The α parameter in fact only tells how fast the density falls inside the maser disk, decreasing by ~4 orders of magnitude in a fraction of a parsec. The resulting distribution of the α parameter is skewed and very steep, peaking at very high values (~8).
Clouds orbiting a SMBH at sub-parsec distances are often modeled with a radial dependence of the form N(r) ~ r− q, where N(r) is the number of clouds per unit length, and q is usually 1 or 2 (e.g., Nenkova et al. 2008b). This translates in a radial dependence of the number of clouds per unit volume of ~r− 3q. If every cloud has approximately the same number of atoms and same chemical composition, the same radial trend holds also for the density ρ to which we refer here. In Fig. 4 we show how our α indexes, which describe the density falling rate in a smooth medium, compare with the power law distributions of clouds in clumpy models. In Fig. 4 we plot the ratio of the outer and inner maser radii as a function of X-ray (deabsorbed) luminosity in the 2−10 keV band. There is no clear correlation between the two quantities. The ratios cluster roughly between the values 2−4. We also plot the ratios expected for different radial distributions with dashed lines of different colors, showing that q indexes of 2−3 are preferred. One possibility for explaining this trend is that the density gradient between the inner and outer maser radii is lower than the assumed one (four orders of magnitude, from 1011 cm-3 at Rin to 107 cm-3 at Rout). For example, a decrease of three orders of magnitude (which is reasonable, assuming current uncertainties) would make the data fully consistent with a distribution of clouds with power law index q = 2. Another possibility is that in a real medium, which is probably a mixture of clumps, voids, and filaments, the density falls abruptly between clouds, steepening the α index. Also warps in maser disks could bias the inner and outer maser radii measurements. Taking the caveats and uncertainties described above into account, we conclude that our analytical formulas for the density are consistent with a radial distribution of clouds N(r) ~ r− q, with q ~ 2,3.
An alternative modelization of our steep density profile is an exponential one: ![Mathematical equation: \begin{equation} \label{eq:einasto} \rho (r) = \rho_{\rm in}\exp\left[-\left(\frac{r-R_{\rm in}}{R_{\rm out}-R_{\rm in}}\right)^{1/n}\ln\left(\frac{\rho_{\rm in}}{\rho_{\rm out}} \right)\right], \end{equation}](/articles/aa/full_html/2016/05/aa27689-15/aa27689-15-eq175.png) (6)where n is the equivalent of the Sersic index. We note that the n = 1 and n = 2 cases are, in general, able to represent Compton-thin and Compton-thick sources, respectively. In other words, results similar to the power law case are found for a mixed density profile, different between Compton-thin and thick sources.
(6)where n is the equivalent of the Sersic index. We note that the n = 1 and n = 2 cases are, in general, able to represent Compton-thin and Compton-thick sources, respectively. In other words, results similar to the power law case are found for a mixed density profile, different between Compton-thin and thick sources.
For each n, the torus outer radius and the column density can be calculated with ![Mathematical equation: \begin{eqnarray} \label{eq:torus_rout_exp} R_{\rm out}^{\rm T}& = &R_{\rm in} + \left(R_{\rm out} - R_{\rm in}\right)\left[\frac{\ln{(\rho_{\rm out}^{\rm T}/\rho_{\rm in})}}{\ln{(\rho_{\rm out}/\rho_{\rm in})}} \right]^n \\ \label{eq:nhgen} N_{\rm H} &= &\frac{n\left(R_{\rm out}-R_{\rm in}\right)}{[\ln{(\rho_{\rm in}/\rho_{\rm out})}]^n}\rho_{\rm in}\left[\Gamma\left(n, \ln{\frac{\rho_{\rm in}}{\rho_{\rm out}}}\right) - \Gamma\left(n, \ln{\frac{\rho_{\rm in}}{\rho_{\rm out}^{\rm T}}}\right) \right], \end{eqnarray}](/articles/aa/full_html/2016/05/aa27689-15/aa27689-15-eq179.png) where Γ(n,x) is the incomplete Gamma function, and Γ(n,0) = Γ(n). In the specific cases n = 1 and n = 2, Eq. (8)becomes
where Γ(n,x) is the incomplete Gamma function, and Γ(n,0) = Γ(n). In the specific cases n = 1 and n = 2, Eq. (8)becomes ![Mathematical equation: \begin{equation} \label{eq:nhexp} \small{N_{\rm H} = \begin{cases} \frac{\left(R_{\rm out} - R_{\rm in}\right)}{\ln{(\rho_{\rm in}/\rho_{\rm out})}}\left(\rho_{\rm out} - \rho_{\rm out}^{\rm T}\right) & n = 1\\[3mm] \frac{2\left(R_{\rm out} - R_{\rm in}\right)}{[\ln{(\rho_{\rm in}/\rho_{\rm out})}]^2}\left\{\rho_{\rm out}\left[\ln{\left(\frac{\rho_{\rm in}}{\rho_{\rm out}}\right)}+1\right] - \rho_{\rm out}^{\rm T}\left[ \ln{\left(\frac{\rho_{\rm in}}{\rho_{\rm out}^{\rm T}}\right)} +1\right] \right\} & n = 2 \end{cases}.} \end{equation}](/articles/aa/full_html/2016/05/aa27689-15/aa27689-15-eq182.png) (9)We can then repeat the same analysis, using Eqs. (7)and (9)to predict the column density distribution with fixed ρout = 107 cm-3 (Fig. 3, bottom panel): notably, the mixed exponential density profile (i.e. with 1 ≤n≤ 2) can reproduce the observed distribution of X-ray measured column densities better than the power law general case.
(9)We can then repeat the same analysis, using Eqs. (7)and (9)to predict the column density distribution with fixed ρout = 107 cm-3 (Fig. 3, bottom panel): notably, the mixed exponential density profile (i.e. with 1 ≤n≤ 2) can reproduce the observed distribution of X-ray measured column densities better than the power law general case.
3.2. The torus size
Instead of assuming the transition density ρout to infer NH, we now use the column densities measured by NuSTAR and reverse the problem. Inverting (9), one can calculate the parameter ρout needed to have a torus with a column density equal to the measured one. The result is that it is sufficient to have a sharp distribution of ρout peaked at 107 cm-3 to have tori with the measured column densities. In other words, fixing the inner maser density ρin and the outer torus density and using the measured column densities, the model points toward a transition density of about 107 cm-2, without knowing anything of the previous theoretical assumptions.
Figure 5 shows the resulting ρout distribution (see Table 4 for numerical values), while Fig. 6 shows the torus outer radius distribution obtained using Eq. (7)(numerical values are reported in Table 4).
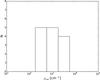 |
Fig. 5 Distribution of the parameter ρout in the sample, calculated as described in Sect. 3.2. See also Table 4. |
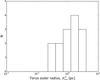 |
Fig. 6 Distribution of torus outer radius predicted by the model, calculated as described in Sect. 3.2. See also Table 4. |
ρout values needed to have NH,meas = NH,pred with the assumption of maser disk-torus density profile continuity, and output of the model, the torus outer radius.
4. Discussion
4.1. Comparison with mid-infrared interferometry
Our toy model allows us to predict the X-ray column density distribution of a sample of disk maser systems or to calculate the torus outer radius if the column density is known. When dealing with very high column densities (i.e., lower limits on NH), the torus outer radius is poorly constrained, since the measured column density can be ascribed to the maser disk without the need of an inflated torus. However, it is interesting to compare our results with mid-infrared (MIR) measurements, which are thought to probe the dusty structure surrounding AGN. In our sample, only NGC 1068 (Raban et al. 2009; López-Gonzaga et al. 2014) and Circinus (Tristram et al. 2007, 2014) have been observed with MIR interferometry. In both sources two distinct structures responsible for the MIR emission are detected. One is an elongated, disk-like structure, which is co-aligned and co-spatial with the maser emission spots and perpendicular to the ionization cones (albeit with the caveat of uncertainty in the absolute astrometry). The second structure, whose origin and theoretical explanation is still unclear, seems to be responsible for diffuse emission on much larger scales (>1 pc), broadly perpendicular to the first. The geometry of this double dusty structure is currently challenging the classical torus framework. These two-component structures are not considered in our simple toy model; however, we note that the sizes are in broad agreement with our predictions, being parsec scales. Another possibility of comparison comes from considering half-light radii (r1 / 2), enclosing half of the MIR flux of the source, as done in Burtscher et al. (2013). We note that the NGC 1068 and Circinus outer radii are less than a factor of two larger than the r1 / 2 values reported by Burtscher et al. (2013). This could be expected, since the outer torus radius should be larger than the half-light one. Moreover, the r1 / 2 of NGC 1068 is broadly twice the r1 / 2 of Circinus; the same happens with in our toy model. Future observations in the MIR band of other sources are needed to probe this scenario.
4.2. Trend with bolometric luminosity
Burtscher et al. (2013) found a clear positive trend of the half-light radius (used as a proxy for the torus size) with the bolometric luminosity, although with large scatter (their Fig. 36). In the near-infrared (NIR), a scaling of the dust sublimation radius with  is well known. However, this relation is much more scattered in the MIR: more luminous sources generally have larger tori with no clear trend. We can then explore whether a relation between the bolometric luminosity and the torus size holds in our toy model. We take Lbol = κbol×
 , where κbol = 20 ± 5 is the bolometric correction, which is constant in our range of intrinsic 2−10 keV luminosities (Steffen et al. 2006; Lusso et al. 2012). We choose a 25% uncertainty on κbol to also include a reasonable error on the 2−10 keV intrinsic luminosity derived from NuSTAR spectral fitting, and we note that using a non-constant bolometric correction would steepen the correlations. We fit our sample with a linear relation of the form log y = a(log Lbol−43.5) + b ± S, where Lbol is measured in erg s-1 and S represents the intrinsic scatter in the relation. We applied a Bayesian analysis with loose priors (uniform for all the unknown parameters, i.e., the slope, the intercept, and the intrinsic scatter). Since our tori are an extension of the maser disks, we first explored the possibility of a correlation between the inner and outer maser radii with bolometric luminosity. Results are shown in Figs. 7a and b. Finally, we repeated the same procedure for the torus outer radius, which is a derived quantity (Fig. 7c – refer to Table 5 for best fit parameters in all three cases). We find an interesting evolution of the trend, going from the absence of a correlation between the inner maser radius and the bolometric luminosity to a positive correlation between the torus outer radius and luminosity, although with large intrinsic scatter. The slopes are, however, all consistent within the uncertainties.
The weak trend of the torus’s outer radius with luminosity could also reflect the weak correlation between maser disks dimensions with luminosity already noted by Greenhill et al. (2003) comparing NGC 4258 and Circinus inner maser radii. We have here confirmed that finding with an enlarged sample. As already suggested by Greenhill et al. (2003), warps in maser disks could break the edge-on geometry condition and bias the disk radial extent measurements.
Rin – Lbol, Rout – Lbol, and – Lbol relations: best fit parameters.
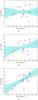 |
Fig. 7 Size-luminosity relations, with progression from an absence of correlation (7a) to a possible one (7c). a) Maser disk inner radius as a function of bolometric luminosity, Lbol. The three Compton-thin sources are indicated by red points. The green line is the best fit linear model, the red dashed lines show the intrinsic scatter of the data, and the cyan shaded area indicates the uncertainty of the model. b) Maser disk outer radius as a function of bolometric luminosity, Lbol. Colors and symbols are the same as in the upper panel. c) Predicted torus outer radius as a function of bolometric luminosity, Lbol. Colors and symbols are the same as in the upper panels. |
4.3. The possible role of warps
Warped disks have been observed in some sources of the sample (Circinus and NGC 4258 are the clearest cases, see Greenhill et al. 2003; Wu et al. 2013, and references therein). Low covering factor and/or fast NH variability (as in the case of NGC 4945, see, e.g., Madejski et al. 2000; Puccetti et al. 2014) could indicate the maser disk as the obscuring structure, instead of invoking an inflated torus. It is easy to see that, when keeping the densities expected by the astrophysical maser theory, only a small fraction of the disk is required to intercept the line of sight to have the measured column density (see Fig. 8). To calculate the radial extent of such a warp, we define Rw as the warping radius and assume that the warp extends up to the maser outer radius, Rout. To calculate Rw, it is sufficient to replace ρout with ρw and with ρout in Eqs. (7)and (9), if adopting an exponential density profile. If using a power law density profile, results are the same within the uncertainties.
In a picture in which there is no standard torus, but only a nearly edge-on molecular disk, a warp of depth ΔRw = Rout − Rw is required to obscure the central engine. Numerical values can be found in Table 6.
ΔRw values needed to have NH,meas = NH,pred with the assumption of all obscuration due to a warp of the maser disk entering the line of sight.
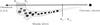 |
Fig. 8 Possible role of warps: rapid NH variability and low covering factor. The obscuring column is provided by a warp of depth ΔRw = Rout − Rw. The thick arrow denotes the observer line of sight. |
5. Conclusions
We presented hard X-ray spectral analyses of NuSTAR data for eight sources out of a sample of 14 nearby disk megamaser galaxies with the aim of exploring the relationship between the maser disk and the environment in which it resides. In our final sample of 14 AGN, 79% are Compton-thick, and 21% are Compton-thin. All these objects are indeed obscured Sy2 galaxies, and show 22 GHz maser emission from water vapor molecules in a dense molecular disk around active SMBHs. We proposed a toy model to explain this connection, where the maser disk is the inner part of the torus, ending in an inflated, geometrically thicker structure. Even if the model is simplistic, it is able to recover the column density distribution for a sample of obscured, disk megamaser AGN, using reasonable density profiles (a power law or, better, an exponential with 1 ≤ n ≤ 2). Alternatively, one can start from the measured Rin, Rout, and NH, assume a reasonable density profile, solve the equations for the crucial parameter ρout, and estimate the torus outer radius, which is found to be on the parsec scale. A direct and robust measure of the torus size is available in two sources (NGC 1068 and Circinus) through mid-IR interferometry. In both cases, the outcomes of the model agree with the half-light radius or single resolved structure size measurements. Clearly, a more physical picture explicitly addressing the known disk/torus clumpiness and warping must rely on numerical calculations.
When we assume a geometry like the one proposed in Fig. 2b, the column density derived with X-ray spectroscopy is due to the inflated end of the clumpy torus alone. Indeed, in ten sources of our sample, NH< 1025 cm-2. This obscuration can be explained if the line of sight does not intercept the masing disk. In the remaining five sources, the column density is compatible with that of the maser disk, which is very optically thick in this framework: these sources could be those seen exactly edge-on, with the line of sight intercepting the geometrically thin maser disk along the equatorial plane. We note, however, that NGC 6264 and UGC 3789 currently lack NuSTAR spectra, and their column density has been estimated using just XMM-Newton (Castangia et al. 2013). Future NuSTAR observations may shed light on the exact value of the column density of these two sources, further constraining the fraction of heavily (NH> 1025 cm-2) Compton-thick AGN in our sample. We finally discussed the possibility that, in some cases, warps in the maser disk may play the role of the classical torus in the AGN unified model, providing low covering factor and fast column density variability.
Acknowledgments
We thank the anonymous referee for useful suggestions that helped to improve the paper. This work was supported under NASA Contract NNG08FD60C, and it made use of data from the NuSTAR mission, a project led by the California Institute of Technology, managed by the Jet Propulsion Laboratory, and funded by the National Aeronautics and Space Administration. We thank the NuSTAR Operations, Software, and Calibration teams for support with the execution and analysis of these observations. This research made use of the NuSTAR Data Analysis Software (NuSTARDAS) jointly developed by the ASI Science Data Center (ASDC, Italy) and the California Institute of Technology (USA). A.M., A.C., and S.P. acknowledge support from the ASI/INAF grant I/037/12/0-011/13. M.B. acknowledges support from NASA Headquarters under the NASA Earth and Space Science Fellowship Program, grant NNX14AQ07H. We acknowledge support from CONICYT-Chile grants Basal-CATA PFB-06/2007 (F.E.B., C.R.), FONDECYT 1141218 (F.E.B., C.R.), “EMBIGGEN” Anillo ACT1101 (F.E.B., C.R.), and the Ministry of Economy, Development, and Tourism’s Millennium Science Initiative through grant IC120009, awarded to The Millennium Institute of Astrophysics, MAS (F. E. B.). W. N. B. acknowledges support from NuSTAR subcontract 44A-1092750.
References
- Aird, J., Alexander, D. M., Ballantyne, D. R., et al. 2015, ApJ, 815, 66 [NASA ADS] [CrossRef] [Google Scholar]
- Antonucci, R. 1993, ARA&A, 31, 473 [Google Scholar]
- Arévalo, P., Bauer, F. E., Puccetti, S., et al. 2014, ApJ, 791, 81 [NASA ADS] [CrossRef] [Google Scholar]
- Arnaud, K. A. 1996, in Astronomical Data Analysis Software and Systems V, eds. G. H. Jacoby, & J. Barnes, ASP Conf. Ser., 101, 17 [Google Scholar]
- Awaki, H., Terashima, Y., Higaki, Y., & Fukazawa, Y. 2009, PASJ, 61, 317 [Google Scholar]
- Baloković, M., Comastri, A., Harrison, F. A., et al. 2014, ApJ, 794, 111 [NASA ADS] [CrossRef] [Google Scholar]
- Barvainis, R. 1987, ApJ, 320, 537 [NASA ADS] [CrossRef] [Google Scholar]
- Bauer, F. E., Arevalo, P., Walton, D. J., et al. 2015, ApJ, 812, 116 [NASA ADS] [CrossRef] [Google Scholar]
- Braatz, J., Greenhill, L., Moran, J., Wilson, A., & Herrnstein, J. 1997, in Am. Astron. Soc. Meet. Abstr., BAAS, 29, 104.02 [Google Scholar]
- Brightman, M., & Nandra, K. 2011, MNRAS, 413, 1206 [CrossRef] [Google Scholar]
- Brightman, M., Baloković, M., Stern, D., et al. 2015, ApJ, 805, 41 [NASA ADS] [CrossRef] [Google Scholar]
- Burtscher, L., Meisenheimer, K., Tristram, K. R. W., et al. 2013, A&A, 558, A149 [NASA ADS] [CrossRef] [EDP Sciences] [Google Scholar]
- Caballero-Garcia, M. D., Papadakis, I. E., Nicastro, F., & Ajello, M. 2012, A&A, 537, A87 [NASA ADS] [CrossRef] [EDP Sciences] [Google Scholar]
- Cash, W. 1979, ApJ, 228, 939 [NASA ADS] [CrossRef] [Google Scholar]
- Castangia, P., Panessa, F., Henkel, C., Kadler, M., & Tarchi, A. 2013, MNRAS, 436, 3388 [NASA ADS] [CrossRef] [Google Scholar]
- Churchwell, E., Witzel, A., Huchtmeier, W., et al. 1977, A&A, 54, 969 [NASA ADS] [Google Scholar]
- Civano, F., Hickox, R. C., Puccetti, S., et al. 2015, ApJ, 808, 185 [NASA ADS] [CrossRef] [Google Scholar]
- Comastri, A. 2004, in Multiwavelength AGN Surveys, eds. R. Mújica, & R. Maiolino, 323 [Google Scholar]
- Elitzur, M., & Shlosman, I. 2006, ApJ, 648, L101 [NASA ADS] [CrossRef] [Google Scholar]
- Fedorova, E. V., Beckmann, V., Neronov, A., & Soldi, S. 2011, MNRAS, 417, 1140 [NASA ADS] [CrossRef] [Google Scholar]
- Gandhi, P., Horst, H., Smette, A., et al. 2009, A&A, 502, 457 [NASA ADS] [CrossRef] [EDP Sciences] [Google Scholar]
- Gilli, R., Comastri, A., & Hasinger, G. 2007, A&A, 463, 79 [NASA ADS] [CrossRef] [EDP Sciences] [Google Scholar]
- Greenhill, L. J., & Gwinn, C. R. 1997, Ap&SS, 248, 261 [NASA ADS] [CrossRef] [Google Scholar]
- Greenhill, L. J., Moran, J. M., & Herrnstein, J. R. 1997, ApJ, 481, L23 [NASA ADS] [CrossRef] [Google Scholar]
- Greenhill, L. J., Booth, R. S., Ellingsen, S. P., et al. 2003, ApJ, 590, 162 [NASA ADS] [CrossRef] [Google Scholar]
- Greenhill, L. J., Tilak, A., & Madejski, G. 2008, ApJ, 686, L13 [NASA ADS] [CrossRef] [Google Scholar]
- Guainazzi, M., Fabian, A. C., Iwasawa, K., Matt, G., & Fiore, F. 2005, MNRAS, 356, 295 [NASA ADS] [CrossRef] [Google Scholar]
- Harrison, F. A., Craig, W. W., Christensen, F. E., et al. 2013, ApJ, 770, 103 [NASA ADS] [CrossRef] [Google Scholar]
- Harrison, F. A., Aird, J., Civano, F., et al. 2015, ApJ, submitted [arXiv:1511.04183] [Google Scholar]
- Henkel, C., Braatz, J. A., Reid, M. J., et al. 2012, in IAU Symp. 287, eds. R. S. Booth, W. H. T. Vlemmings, & E. M. L. Humphreys, 301 [Google Scholar]
- Herrnstein, J. R., Moran, J. M., Greenhill, L. J., & Trotter, A. S. 2005, ApJ, 629, 719 [NASA ADS] [CrossRef] [Google Scholar]
- Kishimoto, M., Hönig, S. F., Beckert, T., & Weigelt, G. 2007, A&A, 476, 713 [NASA ADS] [CrossRef] [EDP Sciences] [Google Scholar]
- Kondratko, P. T., Greenhill, L. J., & Moran, J. M. 2005, ApJ, 618, 618 [NASA ADS] [CrossRef] [Google Scholar]
- Kondratko, P. T., Greenhill, L. J., & Moran, J. M. 2008, ApJ, 678, 87 [NASA ADS] [CrossRef] [Google Scholar]
- Koss, M. J., Romero-Canizales, C., Baronchelli, L., et al. 2015, ApJ, 807, 149 [NASA ADS] [CrossRef] [Google Scholar]
- Kuo, C. Y., Braatz, J. A., Condon, J. J., et al. 2011, ApJ, 727, 20 [NASA ADS] [CrossRef] [Google Scholar]
- Lo, K. Y. 2005, ARA&A, 43, 625 [NASA ADS] [CrossRef] [Google Scholar]
- Lodato, G., & Bertin, G. 2003, A&A, 398, 517 [NASA ADS] [CrossRef] [EDP Sciences] [Google Scholar]
- López-Gonzaga, N., Jaffe, W., Burtscher, L., Tristram, K. R. W., & Meisenheimer, K. 2014, A&A, 565, A71 [NASA ADS] [CrossRef] [EDP Sciences] [Google Scholar]
- Lusso, E., Comastri, A., Simmons, B. D., et al. 2012, MNRAS, 425, 623 [NASA ADS] [CrossRef] [Google Scholar]
- Madejski, G., Życki, P., Done, C., et al. 2000, ApJ, 535, L87 [NASA ADS] [CrossRef] [PubMed] [Google Scholar]
- Magdziarz, P., & Zdziarski, A. A. 1995, MNRAS, 273, 837 [NASA ADS] [CrossRef] [Google Scholar]
- McConnell, N. J., & Ma, C.-P. 2013, ApJ, 764, 184 [NASA ADS] [CrossRef] [Google Scholar]
- Mullaney, J. R., Del-Moro, A., Aird, J., et al. 2015, ApJ, 808, 184 [NASA ADS] [CrossRef] [Google Scholar]
- Murphy, K. D., & Yaqoob, T. 2009, MNRAS, 397, 1549 [NASA ADS] [CrossRef] [Google Scholar]
- Nenkova, M., Sirocky, M. M., Ivezić, Ž., & Elitzur, M. 2008a, ApJ, 685, 147 [NASA ADS] [CrossRef] [Google Scholar]
- Nenkova, M., Sirocky, M. M., Nikutta, R., Ivezić, Ž., & Elitzur, M. 2008b, ApJ, 685, 160 [NASA ADS] [CrossRef] [Google Scholar]
- Netzer, H. 2013, The Physics and Evolution of Active Galactic Nuclei (Cambridge, UK: Cambridge University Press) [Google Scholar]
- Netzer, H. 2015, ARA&A, 53, 365 [NASA ADS] [CrossRef] [Google Scholar]
- Neufeld, D. A., Maloney, P. R., & Conger, S. 1994, ApJ, 436, L127 [NASA ADS] [CrossRef] [Google Scholar]
- Pesce, D. W., Braatz, J. A., Condon, J. J., et al. 2015, ApJ, 810, 65 [NASA ADS] [CrossRef] [Google Scholar]
- Puccetti, S., Comastri, A., Fiore, F., et al. 2014, ApJ, 793, 26 [NASA ADS] [CrossRef] [Google Scholar]
- Raban, D., Jaffe, W., Röttgering, H., Meisenheimer, K., & Tristram, K. R. W. 2009, MNRAS, 394, 1325 [NASA ADS] [CrossRef] [Google Scholar]
- Reid, M. J., Braatz, J. A., Condon, J. J., et al. 2009, ApJ, 695, 287 [NASA ADS] [CrossRef] [Google Scholar]
- Reid, M. J., Braatz, J. A., Condon, J. J., et al. 2013, ApJ, 767, 154 [NASA ADS] [CrossRef] [Google Scholar]
- Risaliti, G., Maiolino, R., & Salvati, M. 1999, ApJ, 522, 157 [NASA ADS] [CrossRef] [Google Scholar]
- Steffen, A. T., Strateva, I., Brandt, W. N., et al. 2006, AJ, 131, 2826 [NASA ADS] [CrossRef] [Google Scholar]
- Tarchi, A. 2012, in IAU Symp. 287, eds. R. S. Booth, W. H. T. Vlemmings, & E. M. L. Humphreys, 323 [Google Scholar]
- Tilak, A., Greenhill, L. J., Done, C., & Madejski, G. 2008, ApJ, 678, 701 [NASA ADS] [CrossRef] [Google Scholar]
- Treister, E., Urry, C. M., & Virani, S. 2009, ApJ, 696, 110 [NASA ADS] [CrossRef] [Google Scholar]
- Tristram, K. R. W., Meisenheimer, K., Jaffe, W., et al. 2007, A&A, 474, 837 [NASA ADS] [CrossRef] [EDP Sciences] [Google Scholar]
- Tristram, K. R. W., Burtscher, L., Jaffe, W., et al. 2014, A&A, 563, A82 [NASA ADS] [CrossRef] [EDP Sciences] [Google Scholar]
- Urry, C. M., & Padovani, P. 1995, PASP, 107, 803 [NASA ADS] [CrossRef] [Google Scholar]
- Vasylenko, A. A., Fedorova, E. V., Hnatyk, B. I., & Zhdanov, V. I. 2015, Kinematics and Physics of Celestial Bodies, 31, 13 [NASA ADS] [CrossRef] [Google Scholar]
- Wu, Q., Yan, H., & Yi, Z. 2013, MNRAS, 436, 1278 [NASA ADS] [CrossRef] [Google Scholar]
- Yamauchi, A., Nakai, N., Ishihara, Y., Diamond, P., & Sato, N. 2012, PASJ, 64, 103 [NASA ADS] [CrossRef] [Google Scholar]
- Yaqoob, T. 1997, ApJ, 479, 184 [NASA ADS] [CrossRef] [Google Scholar]
- Yaqoob, T. 2012, MNRAS, 423, 3360 [NASA ADS] [CrossRef] [Google Scholar]
- Zhu, G., Zaw, I., Blanton, M. R., & Greenhill, L. J. 2011, ApJ, 742, 73 [NASA ADS] [CrossRef] [Google Scholar]
All Tables
NuSTAR X-ray best fit spectral results for the eight sources analyzed (see text).
ρout values needed to have NH,meas = NH,pred with the assumption of maser disk-torus density profile continuity, and output of the model, the torus outer radius.
ΔRw values needed to have NH,meas = NH,pred with the assumption of all obscuration due to a warp of the maser disk entering the line of sight.
All Figures
|
Fig. 1 NuSTAR spectra, best-fitting models and residuals for the eight sources analyzed. FPMA data are shown in black, while FPMB ones are shown in blue. When adopting a MYTorus model, the solid line represents the primary continuum. The reflection and line components are shown as the dashed line, while the scattered power law is shown as the dotted line. When adopting the Torus model, the solid line represents the total spectrum, while add-on line components are shown as the dashed line. |
| In the text | |
|
Fig. 2 Sketches of the two possible geometries for the location of the maser disk inside the torus. Sizes are not to scale, and the sketches are just meant to display the different possible locations of the maser disk. a) The disk is part of the equatorial plane of the torus. b) The disk inflates in its outer part, giving rise to a geometrically thicker structure. The change from the inner part to the outer one is not abrupt and occurs with a gradual change in the dimensions and physical conditions of the clumps, encoded in the same density profile. |
| In the text | |
|
Fig. 3 Top panel: distribution of NH as measured by X-ray spectral fitting. Middle panel: distribution of column densities predicted by the model, using a power law density profile. Bottom panel: distribution of column densities predicted by the model, with mixed exponential density profile (see text). |
| In the text | |
|
Fig. 4 Ratio of outer and inner maser radii for the sources in the sample as a function of X-ray (deabsorbed) luminosity in the 2−10 keV band. The trend N(r) ~ r-1 (blue dashed line) seems to be ruled out, while N(r) ~ r-2 and N(r) ~ r-3 (red and green dashed lines, respectively) are preferred. We note that the ratios expected for different clouds distributions depend on the critical maser densities assumed, being the expected ratio for a particular q, Rout/Rin = 10log (ρin/ρout) / 3q. |
| In the text | |
|
Fig. 5 Distribution of the parameter ρout in the sample, calculated as described in Sect. 3.2. See also Table 4. |
| In the text | |
|
Fig. 6 Distribution of torus outer radius predicted by the model, calculated as described in Sect. 3.2. See also Table 4. |
| In the text | |
|
Fig. 7 Size-luminosity relations, with progression from an absence of correlation (7a) to a possible one (7c). a) Maser disk inner radius as a function of bolometric luminosity, Lbol. The three Compton-thin sources are indicated by red points. The green line is the best fit linear model, the red dashed lines show the intrinsic scatter of the data, and the cyan shaded area indicates the uncertainty of the model. b) Maser disk outer radius as a function of bolometric luminosity, Lbol. Colors and symbols are the same as in the upper panel. c) Predicted torus outer radius as a function of bolometric luminosity, Lbol. Colors and symbols are the same as in the upper panels. |
| In the text | |
|
Fig. 8 Possible role of warps: rapid NH variability and low covering factor. The obscuring column is provided by a warp of depth ΔRw = Rout − Rw. The thick arrow denotes the observer line of sight. |
| In the text | |
Current usage metrics show cumulative count of Article Views (full-text article views including HTML views, PDF and ePub downloads, according to the available data) and Abstracts Views on Vision4Press platform.
Data correspond to usage on the plateform after 2015. The current usage metrics is available 48-96 hours after online publication and is updated daily on week days.
Initial download of the metrics may take a while.