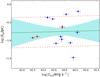
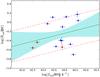
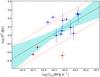
Fig. 7

Size-luminosity relations, with progression from an absence of correlation (7a) to a possible one (7c). a) Maser disk inner radius as a function of bolometric luminosity, Lbol. The three Compton-thin sources are indicated by red points. The green line is the best fit linear model, the red dashed lines show the intrinsic scatter of the data, and the cyan shaded area indicates the uncertainty of the model. b) Maser disk outer radius as a function of bolometric luminosity, Lbol. Colors and symbols are the same as in the upper panel. c) Predicted torus outer radius as a function of bolometric luminosity, Lbol. Colors and symbols are the same as in the upper panels.
Current usage metrics show cumulative count of Article Views (full-text article views including HTML views, PDF and ePub downloads, according to the available data) and Abstracts Views on Vision4Press platform.
Data correspond to usage on the plateform after 2015. The current usage metrics is available 48-96 hours after online publication and is updated daily on week days.
Initial download of the metrics may take a while.