Fig. 4
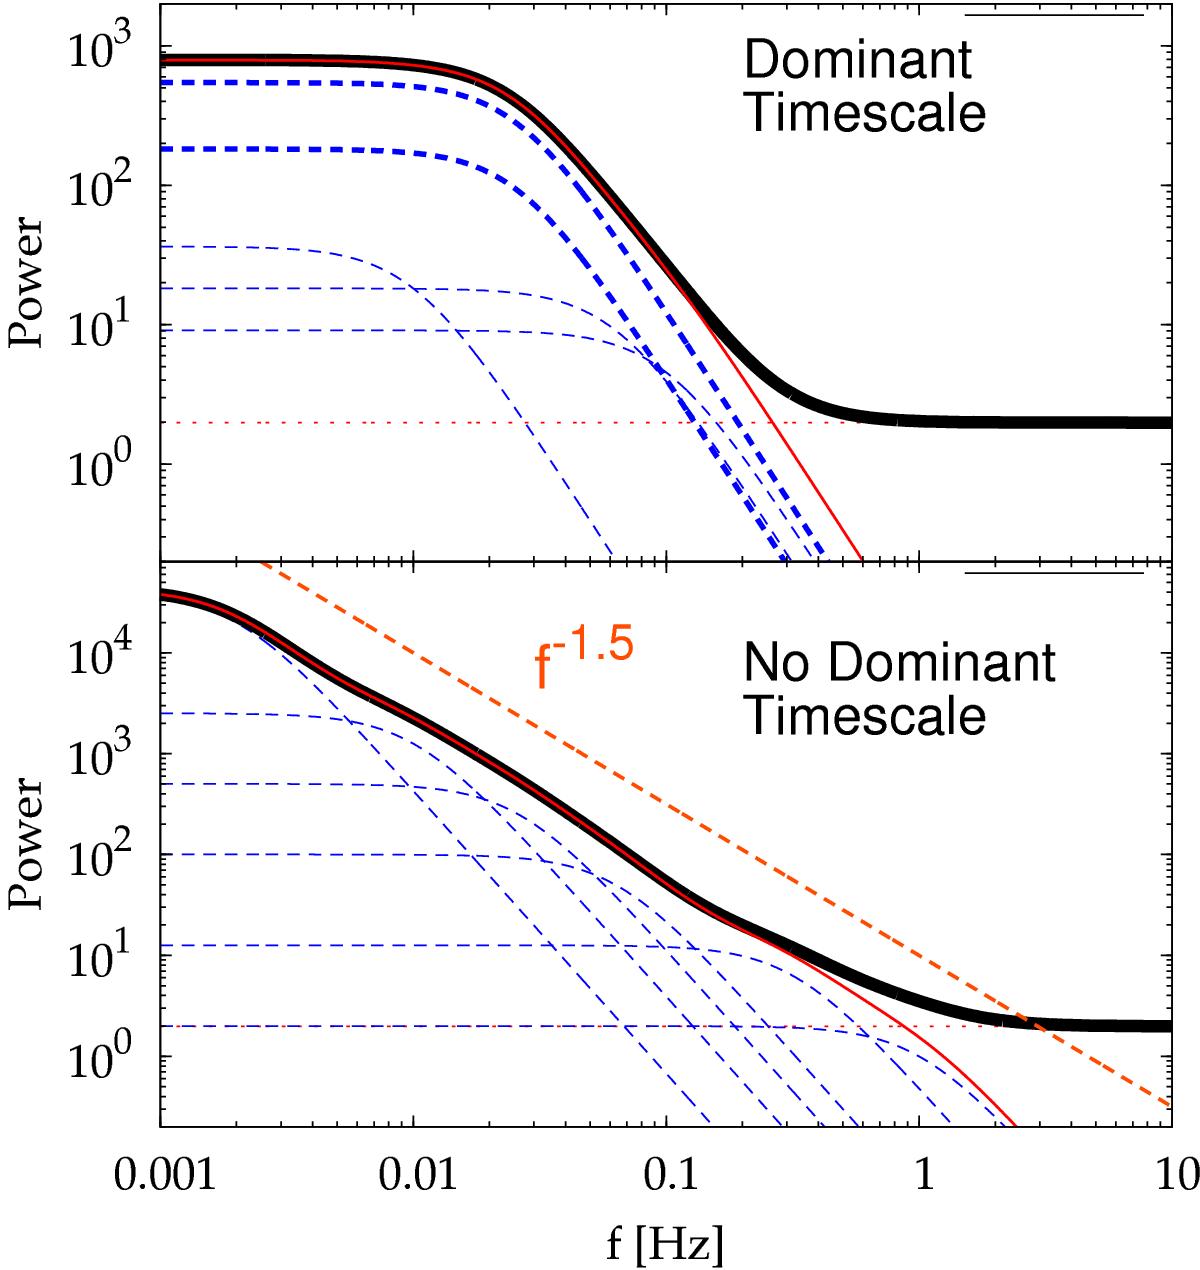
Top panel: sketch of a bpl PDS (thick solid line) as the result of the superposition of PDS of different pulses (thin dashed lines). The overall variance is dominated by pulses with similar timescales (thick dashed lines), whose frequency break there corresponds to the dominant time. The white-noise level is also shown (dotted line). Bottom panel: the pl PDS is the result of the superposition of different pulses with different timescales, so that no break stands out in the total PDS, which looks like a power-law with a shallow index (α = 1.5 in this example, thick dashed line).
Current usage metrics show cumulative count of Article Views (full-text article views including HTML views, PDF and ePub downloads, according to the available data) and Abstracts Views on Vision4Press platform.
Data correspond to usage on the plateform after 2015. The current usage metrics is available 48-96 hours after online publication and is updated daily on week days.
Initial download of the metrics may take a while.