Fig. 1
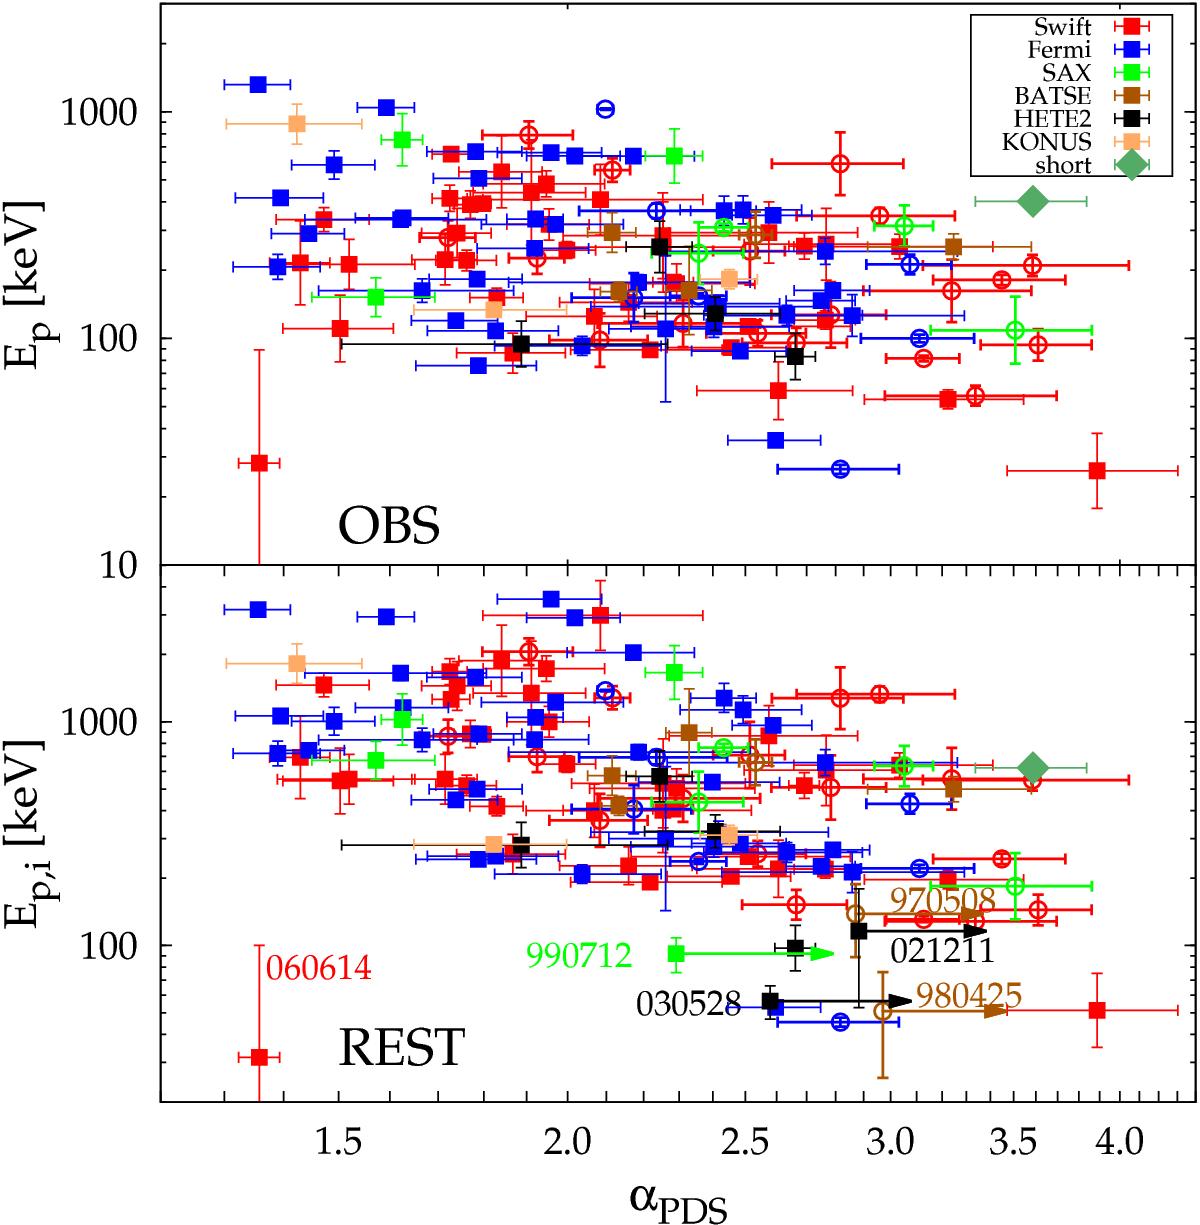
Peak energy vs. PDS slope in the observer (top) and in the source rest-frame (bottom). Different colours correspond to different experiments. Filled squares (empty circles) correspond to power-law (broken power-law) models. Lower limits on α are given at 90% confidence. The only short available is also shown for comparison (diamond).
Current usage metrics show cumulative count of Article Views (full-text article views including HTML views, PDF and ePub downloads, according to the available data) and Abstracts Views on Vision4Press platform.
Data correspond to usage on the plateform after 2015. The current usage metrics is available 48-96 hours after online publication and is updated daily on week days.
Initial download of the metrics may take a while.