Fig. 9
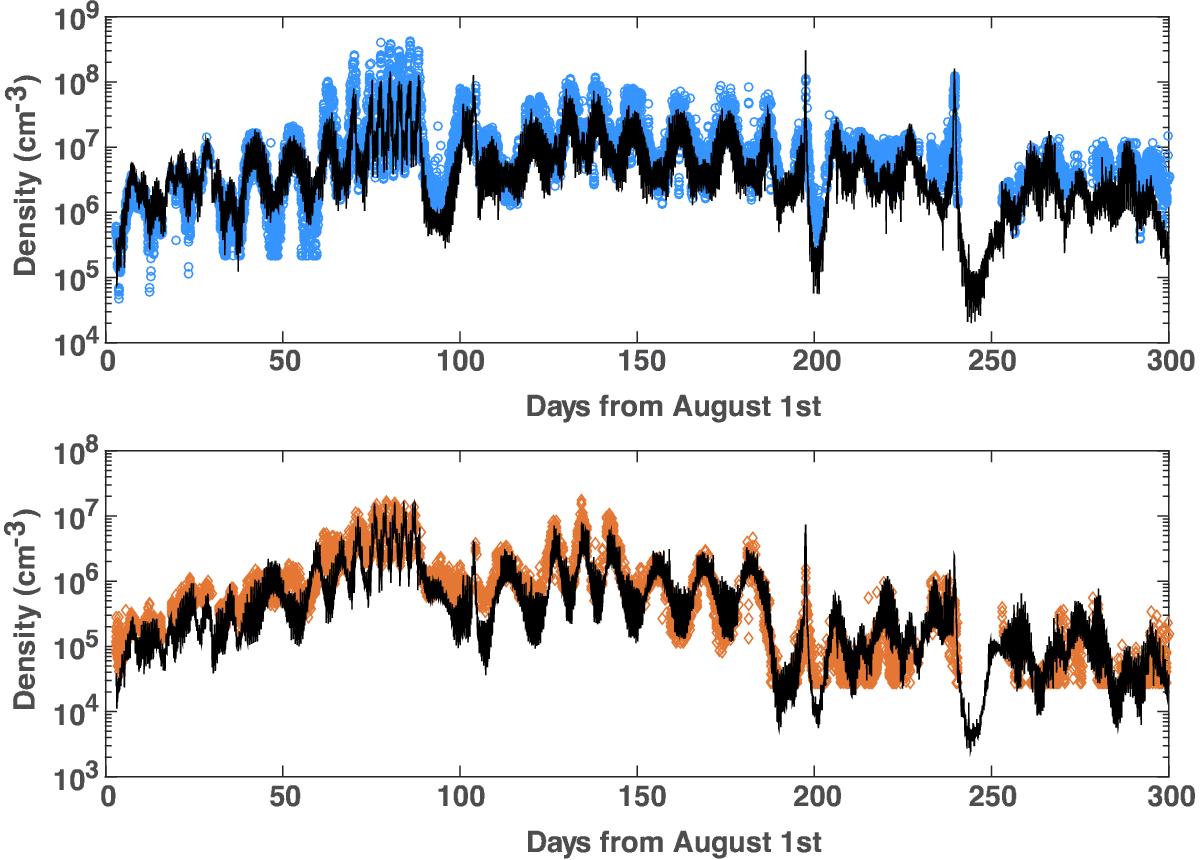
Density extracted at the location of the spacecraft every hour from the DSMC outputs choosing the case from the 48 runs with the closest Sun/comet geometry. The top panel is for water with the DFMS/COPS in blue circles and the DSMC model in black. The bottom panel represents CO2 with DFMS/COPS data in orange and the DSMC model in black.
Current usage metrics show cumulative count of Article Views (full-text article views including HTML views, PDF and ePub downloads, according to the available data) and Abstracts Views on Vision4Press platform.
Data correspond to usage on the plateform after 2015. The current usage metrics is available 48-96 hours after online publication and is updated daily on week days.
Initial download of the metrics may take a while.