Fig. 6
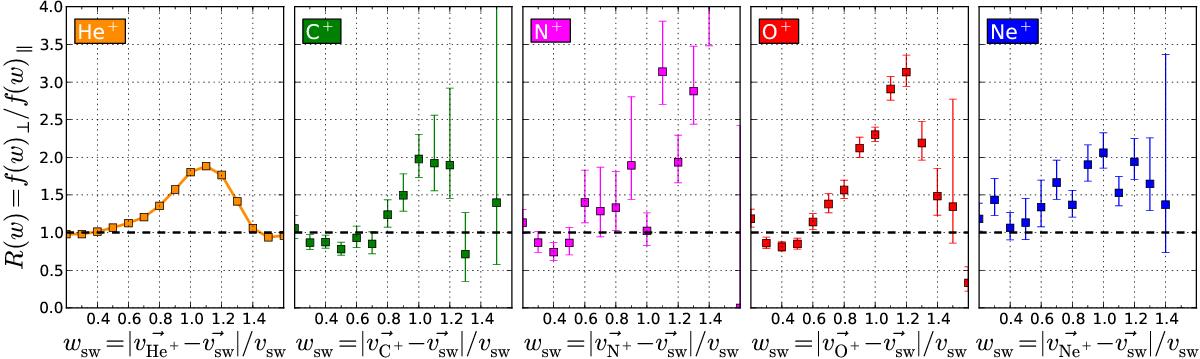
The ratio, R(wsw) (Eq. (5)), of the pickup ion flux as a function of wsw between magnetic configurations φ⊥ and φ∥ for He+, C+, N+, O+, and Ne+ (panels from left to right). The data was collected between March 2007 and December 2013 during periods in which the solar wind velocity was below 450 km s-1. As illustrated in Fig. 5, the magnetic configurations φ⊥ and φ∥ correspond to configurations in which the pickup ion torus lies inside and outside the instrument’s aperture respectively. The ratio f(w)⊥/f(w)∥ is therefore an indicator of the relative flux increase induced by the pickup ion torus distribution or, in more general terms, an indicator for the anisotropy of the pickup ion VDF.
Current usage metrics show cumulative count of Article Views (full-text article views including HTML views, PDF and ePub downloads, according to the available data) and Abstracts Views on Vision4Press platform.
Data correspond to usage on the plateform after 2015. The current usage metrics is available 48-96 hours after online publication and is updated daily on week days.
Initial download of the metrics may take a while.