Fig. 2
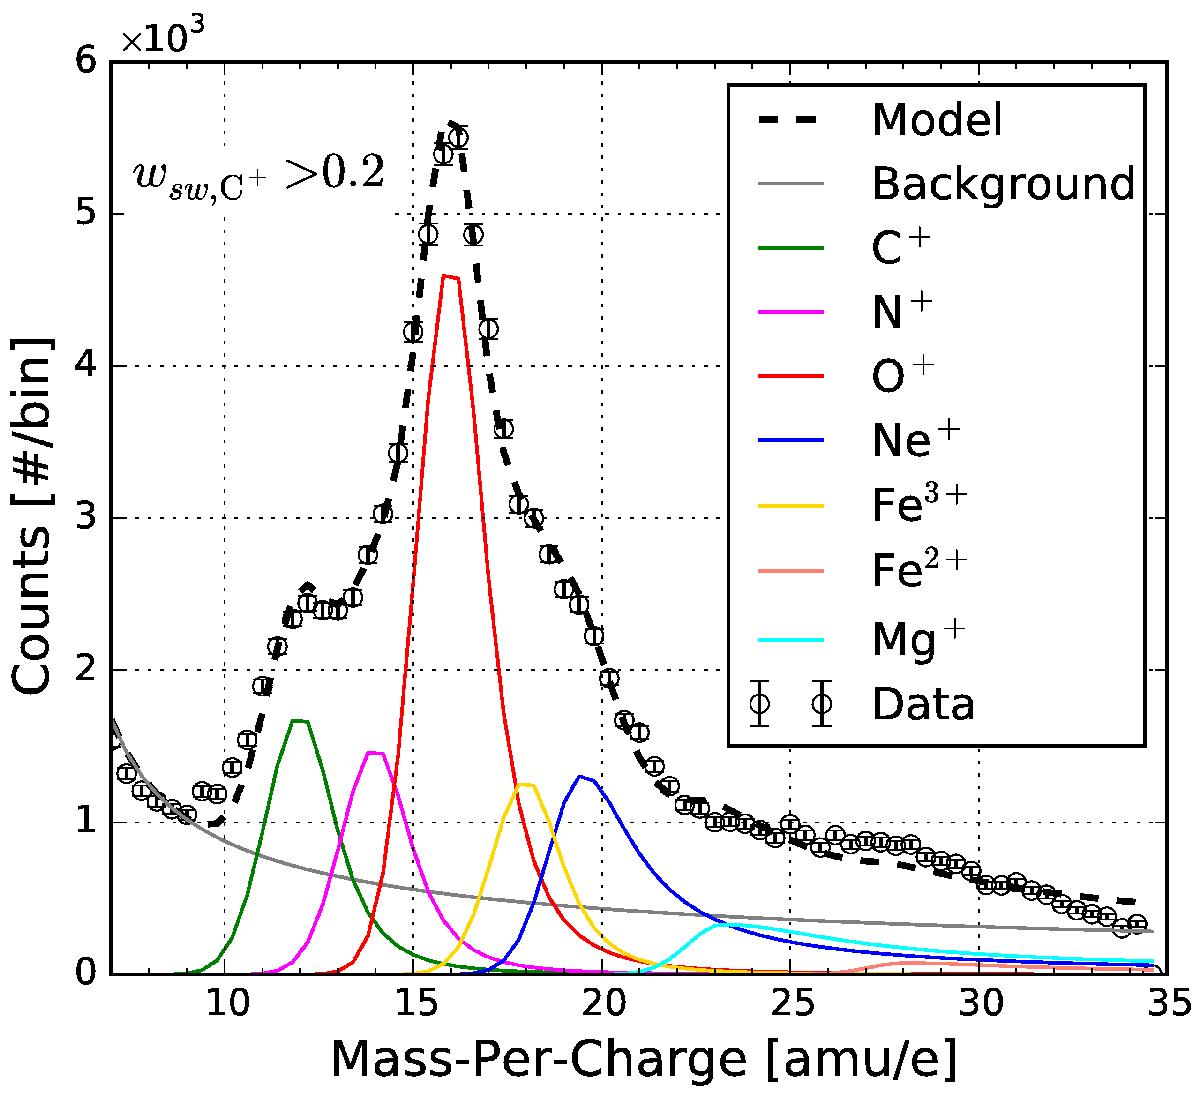
Mass-per-charge spectrum of heavy pickup ions (Δm/q = 0.4 amu/e) observed by PLASTIC on board STEREO A. The data was accumulated for a period of 2400 days, beginning in March 2007, and C+ velocities of wsw,C+> 0.2 (open circles). A mass-per-charge model (dashed black line) was fitted to the data to obtain the absolute abundances of C+, N+, O+, Fe3+, Ne+, Mg+, and Fe2+ in terms of instrumental count rates. An exponential model was included to estimate and incorporate the influence of instrumental background to the mass-per-charge spectrum between 10 <m/q< 35 amu/e.
Current usage metrics show cumulative count of Article Views (full-text article views including HTML views, PDF and ePub downloads, according to the available data) and Abstracts Views on Vision4Press platform.
Data correspond to usage on the plateform after 2015. The current usage metrics is available 48-96 hours after online publication and is updated daily on week days.
Initial download of the metrics may take a while.