Fig. 10
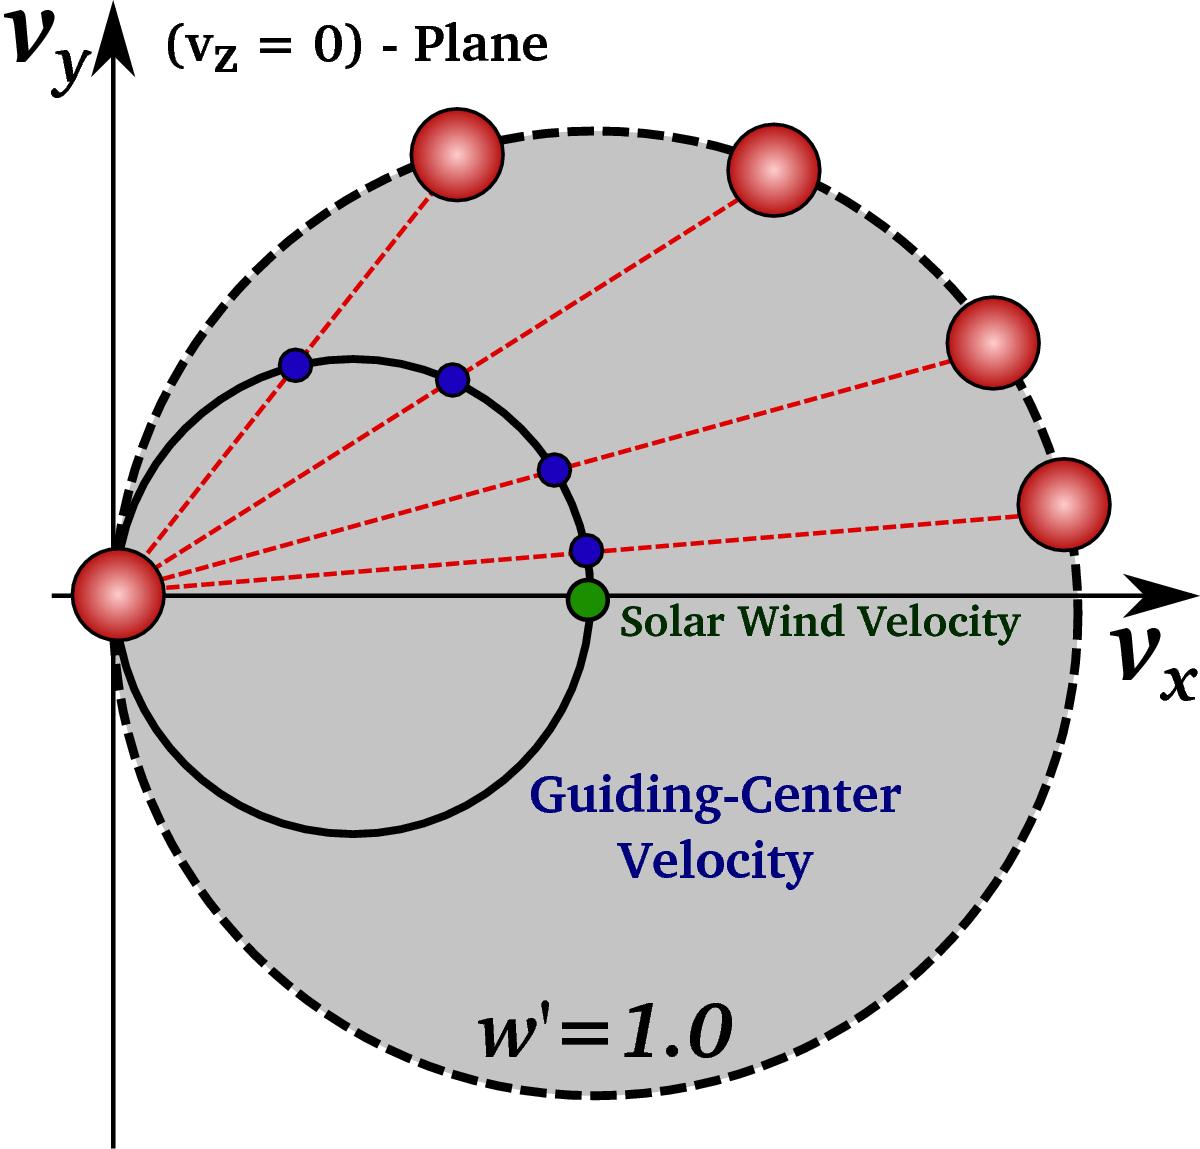
Velocity space diagram of He+ torus distributions (red) at different configurations of the solar magnetic field. Corresponding guiding centre velocities of the respective distributions are shown as blue circles. The solar wind speed is shown as a green circle. Evidently, the torus’ guiding centre velocity equals the solar wind speed only for magnetic configurations where φB = ± 90° (see also Fig. 5).
Current usage metrics show cumulative count of Article Views (full-text article views including HTML views, PDF and ePub downloads, according to the available data) and Abstracts Views on Vision4Press platform.
Data correspond to usage on the plateform after 2015. The current usage metrics is available 48-96 hours after online publication and is updated daily on week days.
Initial download of the metrics may take a while.