| Issue |
A&A
Volume 588, April 2016
|
|
|---|---|---|
| Article Number | A145 | |
| Number of page(s) | 20 | |
| Section | Planets and planetary systems | |
| DOI | https://doi.org/10.1051/0004-6361/201527585 | |
| Published online | 01 April 2016 | |
The SOPHIE search for northern extrasolar planets
X. Detection and characterization of giant planets by the dozen⋆,⋆⋆
1
Institut d’Astrophysique de Paris, UMR 7095 CNRS, Université
Pierre & Marie Curie, 98bis
boulevard Arago, 75014
Paris,
France
e-mail:
This email address is being protected from spambots. You need JavaScript enabled to view it.
2
Observatoire de Haute-Provence, CNRS, Université
d’Aix-Marseille, 04870, Saint-Michel-l’Observatoire, France
3
Université J. Fourier (Grenoble 1)/CNRS, Laboratoire
d’Astrophysique de Grenoble (LAOG, UMR 5571), 38041 Saint-Martin d’Hères, France
4
CIDMA, Departamento de Física, Universidade de
Aveiro, Campus de
Santiago, 3810-193
Aveiro,
Portugal
5
ASD/IMCCE, CNRS-UMR 8028, Observatoire de Paris,
PSL, UPMC, 77 Avenue
Denfert-Rochereau, 75014
Paris,
France
6
Aix Marseille Université, CNRS, LAM (Laboratoire d’Astrophysique
de Marseille) UMR 7326, 13388
Marseille,
France
7
Observatoire de Genève, Université de Genève,
51 Chemin des Maillettes,
1290
Sauverny,
Switzerland
8
Institute for Astronomy, University of Hawaii,
2680 Woodlawn Drive,
Honolulu, HI
96822,
USA
9
European Space Agency, European Space Astronomy Centre, PO Box 78,
Villanueva de la Canada, 28691
Madrid,
Spain
10
Instituto de Astrofísica e Ciências do Espaço, Universidade do
Porto, CAUP, Rua das
Estrelas, 4150-762
Porto,
Portugal
11
Departamento de Física e Astronomia, Faculdade de Ciências,
Universidade do Porto, Rua Campo
Alegre, 4169-007
Porto,
Portugal
12
Atalaia Group, CROW-Observatory Portalegre,
4169-007
Porto,
Portugal
13
National Astronomical Observatory of Japan,
Subaru Telescope, 650 North A’Ohoku
Place, Hilo,
HI, 96720, USA
14 Department of Physics and Astronomy, Macquarie University,
NSW 2109, Australia
15
Centre d’Astronomie, Plateau du Moulin à Vent, 04870 Saint-Michel-l’Observatoire, France
16
Canada France Hawaii Telescope Corporation,
Kamuela, HI
96743,
USA
17
Oversky, 47 Allée des Palanques, 33127
Saint-Jean-d’Illac,
France
Received: 17 October 2015
Accepted: 13 February 2016
Abstract
We present new radial velocity measurements of eight stars that were secured with the spectrograph SOPHIE at the 193 cm telescope of the Haute-Provence Observatory. The measurements allow detecting and characterizing new giant extrasolar planets. The host stars are dwarfs of spectral types between F5 and K0 and magnitudes of between 6.7 and 9.6; the planets have minimum masses Mp sin i of between 0.4 to 3.8 MJup and orbitalperiods of several days to several months. The data allow only single planets to be discovered around the first six stars (HD 143105, HIP 109600, HD 35759, HIP 109384, HD 220842, and HD 12484), but one of them shows the signature of an additional substellar companion in the system. The seventh star, HIP 65407, allows the discovery of two giant planets that orbit just outside the 12:5 resonance in weak mutual interaction. The last star, HD 141399, was already known to host a four-planet system; our additional data and analyses allow new constraints to be set on it. We present Keplerian orbits of all systems, together with dynamical analyses of the two multi-planet systems. HD 143105 is one of the brightest stars known to host a hot Jupiter, which could allow numerous follow-up studies to be conducted even though this is not a transiting system. The giant planets HIP 109600b, HIP 109384b, and HD 141399c are located in the habitable zone of their host star.
Key words: planetary systems / techniques: radial velocities / techniques: photometric
Based on observations collected with the SOPHIE spectrograph on the 1.93-m telescope at Observatoire de Haute-Provence (CNRS), France, by the SOPHIE Consortium (programs 07A.PNP.CONS to 15A.PNP.CONS).
Full version of the SOPHIE measurements (Table 1) is only available at the CDS via anonymous ftp to cdsarc.u-strasbg.fr (130.79.128.5) or via http://cdsarc.u-strasbg.fr/viz-bin/qcat?J/A+A/588/A145
© ESO, 2016
1. Introduction
Since its installation in late 2006 at the 193 cm telescope of the Haute-Provence Observatory (OHP), the spectrograph SOPHIE is used among other programs to perform a volume-limited survey of giant extrasolar planets (Bouchy et al. 2009). The goal of this survey is to improve the statistics on the exoplanet parameters and their hosting stars by increasing the number of known Jupiter-mass planets, and to identify particular cases allowing interesting follow-up studies, for instance, on dynamics for multi-planet systems, or on structure characterization if the planets are found to transit their host star. Numerous questions about giant planets remain open, the first of which is how they formed. The formation mechanisms may be understood through core-accretion (e.g., Mordasini et al. 2009; Guilera et al. 2010) or disk-instability (e.g., Cai et al. 2010; Boss 2011) models. The subsequent evolution of the planets is subject to debates as well, concerning, for example, their migration processes (e.g., Lin et al. 1996; Levison et al. 2006; Carter-Bond et al. 2012) or the existence of a population of inflated close-in planets that are most likely related to interactions with their host stars through tides or irradiation, for instance (e.g., Baraffe et al. 2014). The physics of the internal planetary structures (e.g., Liu et al. 2015) and atmospheres (e.g., Sing et al. 2016) are also far from being fully understood. Thus, detecting and characterizing new giant planets provides constraints on their formation and evolution models and allows exploring the diversity of planetary systems.
Among the ~2000 exoplanets that are known so far according the Exoplanet Encyclopaedia1, only about 1100 have a mass measurement, which is for most of them measured from radial velocities. Fewer than 700 have a mass measured with an accuracy better than ± 30%, and fewer than 280 have both mass and radius known (Han et al. 2014)2. Accurate radial velocity measurements remain an efficient and powerful technique for researching and characterizing exoplanet systems. By comparison to transiting surveys, radial velocity measurements are particularly powerful in detecting multi-planet systems and in constructing the orbital period distribution on its longer part. They also provide the planetary mass distributions, allowing super-Earths, giant planets, and brown dwarfs populations to be distinguished and studied.
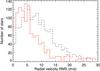 |
Fig. 1 Histogram of the radial velocity dispersions for 1900 stars observed with SOPHIE since 2006 as part of the giant planet survey (dashed black line). The typical accuracy is about ± 7 m/s. The histogram plotted as a solid red line selects only the measurements secured after SOPHIE was improved in June 2011; it shows an improvement of the radial velocity accuracy on a level of ± 3.5 m/s. To allow a better comparison between the two histograms, the y-scale of the red histogram has been multiplied by a factor four. |
In its current version, the catalog of the SOPHIE survey for giant planets includes 2300 dwarf stars at distance < 60 pc and with B − V between 0.35 and 1.0. Most of them (about 1900) have been observed with SOPHIE. Figure 1 shows histograms of the radial velocity dispersion of all the stars with at least two SOPHIE measurements. Since its upgrade in June 2011, the typical accuracy of this program was reduced from ± 7 m/s to ± 3.5 m/s. The main reason for this amelioration is that the SOPHIE fiber-link scrambling properties were improved by implementing pieces of octagonal-section fibers (Bouchy et al. 2013). This accuracy allows Jupiter-mass planets to be detected on periods of up to several years or Saturn-mass planets on periods of up to several months.
The SOPHIE survey has already allowed detecting and characterizing several planets (Da Silva et al. 2008; Santos et al. 2008; Bouchy et al. 2009; Hébrard et al. 2010; Boisse et al. 2010; Moutou et al. 2014; Díaz et al. 2016a) and more massive companions at the planet-brown dwarf boundary (Díaz et al. 2012; Wilson et al. 2016). Here we present the discovery of six new single planets in orbit around the stars HD 143105, HIP 109600, HD 35759, HIP 109384, HD 220842, and HD 12484, and of a two-planet system around HIP 65407. We also present new measurements and analyses of the multi-planet system orbiting HD 141399, which has previously been announced by Vogt et al. (2014) while we were independently monitoring it with SOPHIE.
The SOPHIE observations and data reduction are presented in Sect. 2. We determine the parameters of the host stars in Sect. 3, then derive and discuss the planetary systems properties in Sects. 4 and 5 for single and multi-planet systems, respectively, before we conclude in Sect. 6.
2. SOPHIE spectroscopy and radial velocities
We observed the eight stars with SOPHIE at the OHP 1.93 m telescope. SOPHIE is a cross-dispersed, environmentally stabilized echelle spectrograph dedicated to high-precision radial velocity measurements (Perruchot et al. 2008; Bouchy et al. 2009). Observations were secured in fast-reading mode of the detector and in high-resolution mode of the spectrograph, allowing a resolution power of λ/ Δλ = 75 000 to be reached. Depending on the star, the spectra were obtained over time spans of two to eight years. Their typical exposure times are a few minutes to reach a signal-to-noise ratio per pixel at 550 nm of around 50. The final dataset presented here represents nearly 600 exposures for a total integration time exceeding 60 hours on the sky. For all the exposures the first optical fiber aperture was used for starlight, whereas the second was placed on the sky to evaluate the sky background pollution, especially from moonlight. Wavelength calibrations were made at the beginning and end of each observing night, and with a frequencyofabouttwohours during the nights. This allows the drift of the instrument to be interpolated at the time of each exposure. Four stars were observed both before and after the SOPHIE upgrade of June 2011 (Sect. 1; Bouchy et al. 2013). As the upgrade introduces significant differences, we considered two distinct datasets for each of them, namely SOPHIE and SOPHIE+, depending on whether the data were acquired before or after the upgrade. The four remaining stars were only observed after the upgrade (SOPHIE+ only).
We used the SOPHIE pipeline (Bouchy et al. 2009) to extract the spectra from the detector images, cross-correlate them with numerical masks, which produced clear cross-correlation functions (CCFs), then fit the CCFs by Gaussians to derive the radial velocities (Baranne et al. 1996; Pepe et al. 2002). The bisector spans of each CCF were also computed following Queloz et al. (2001). All the 39 SOPHIE spectral orders (covering the wavelength range 3872 Å–6943 Å) were used for the cross-correlations. Spectra that were significantly polluted by sky background (in particular moonlight) were corrected following the method described, for instance, by Bonomo et al. (2010). Each exposure was then corrected for the interpolated drift of the instrument. For SOPHIE+ data, we also applied the RV constant master correction presented by Courcol et al. (2015), which takes for small additional instrumental drifts into account.
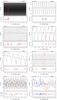 |
Fig. 2 Radial velocity SOPHIE measurements of the eight stars as a function of time (values before and after the June-2011 upgrade are plotted in blue and red), and Keplerian fits. The orbital parameters corresponding to the Keplerian fits are reported in Tables 3 and 4. In each panel, the residuals with 1σ error bars are plotted below the fit. |
Radial velocities (barycentric referential) and bisector span measured with SOPHIE.
The derived radial velocities and bisector spans are reported in Table 1. Typical uncertainties are between 3 and 10 m/s depending on the stellar properties and actual signal-to-noise ratio of the spectra. This includes photon noise and wavelength calibration uncertainty; the latter is estimated to be on the order of 2 m/s for each exposure. For the exposures obtained before the June 2011 upgrade, we also quadratically added an additional uncertainty of 5 m/s to account for the poor scrambling properties at that time (Bouchy et al. 2013). The final uncertainties do not include any jitter due to stellar activity. The uncertainties reported here are significantly larger than those obtained with SOPHIE+ by Courcol et al. (2015) on stars of similar magnitudes and spectral types to detect low-mass planets. This is due to three main reasons. First, the exposure times and obtained signal-to-noise ratios are lower here, therefore the radial velocity uncertainty due to photon noise is larger. Second, as the exposure times are shorter, the short-term stellar intrinsic variations are less efficaciously averaged out. Finally, the SOPHIE observations of Courcol et al. (2015) were made with simultaneous wavelength calibration in the second entrance aperture, which is not the case here. This illustrates the different strategies adopted with a given instrument to reach distinct goals. Because the present program aims at detecting giant planets, it could be performed at lower accuracy. In addition, it does not need perfect weather conditions and could continue even when thin clouds were in the sky, and at times of poor seeing or significant sky background pollution due to moonlight or even twilight.
The SOPHIE radial velocities of the eight stars are plotted in Fig. 2 as a function of time. They all show variations that exceed the expected dispersion due to the measurement accuracy and the possible stellar jitter. The bisectors of the CCFs (Table 1) are stable for each object; they show dispersions well below that of the radial velocities variations. An anticorrelation between the bisector and the radial velocity is usually the signature of radial velocity variations induced by stellar activity (see, e.g., Queloz et al. 2001; Boisse et al. 2009). Lomb-Scargle periodograms of the bisectors do not show any significant feature either. Similarly, other indicators linked to stellar activity, including CCF widths or Ca ii emission index  , do not show any significant peaks in their periodograms. All of this indicates that the radial velocity variations are mainly due to Doppler shifts of the stellar lines and not to stellar profile variations. We therefore conclude that reflex motions due to companion(s) are the likely causes of the stellar radial velocity variations. The amplitudes of the variations place the companions in the planet-mass regime.
3. Properties of the eight planet-host stars
Table 2 summarizes the stellar parameters of the eight planet-host stars. Magnitudes, B − V, and parallaxes are taken from Hipparcos (Perryman et al. 1997). For each star we constructed an averaged spectrum using all the SOPHIE spectra that were unaffected by Moon pollution, and we performed spectral analyses from them. We used the method presented in Santos et al. (2004) and Sousa et al. (2008) to derive the effective temperatures Teff, the surface gravities log g, and the metallicities [ Fe / H ]. The metallicities computed using the CCF calibration presented by Boisse et al. (2010) agree with the above ones, but we did not adopt these values as they are less accurate (typically ± 0.09 dex) than those obtained from stellar spectroscopic analysis. Using those derived spectroscopic parameters as input, stellar masses were derived from the calibration of Torres et al. (2010) with a correction following Santos et al. (2013). Errors were computed from 10 000 random values of the stellar parameters within their error bars and assuming Gaussian distributions. We derived the projected rotational velocities v sin i⋆ and their uncertainties from the parameters of the CCF using the calibration of Boisse et al. (2010).
The eight planet hosts are dwarf stars of spectral types between F5 and K0. Three stars are metal-poor (HIP 109600, HIP 109384, and HD 220842) and three are metal-rich (HD 143105, HIP 65407, and HD 141399), the two remaining stars have solar metallicities. They show standard slow rotations with v sin i⋆ on the order of 2 to 4 km s-1, with the two exceptions of HD 143105 and HD 12484, which show faster rotations with v sin i⋆ on the order of 8 to 9 km s-1.
The activity levels of the stars were evaluated from the Ca ii emission index . The reported values and uncertainties are the averages and dispersions of values measured on each epoch for a given star. We note that the stars with the highest values of are those for which this index shows the least dispersion with time. This might be surprising as active stars are expected to have stronger variations of than quiet stars. Here the larger uncertainties in values of inactive stars are due to the larger dispersion they show, which in turn is due to the lower signal-to-noise ratios in the center of the cores of their H and K Ca ii lines. Active stars have stronger flux in those lines, which implies higher signal-to-noise ratios and smaller dispersions. The three stars that present the lowest also have lower log g values. This could be a sign that these stars are beginning their evolution to become subgiants, for which the calibration is not effective. As shown in Fig. 3, only two stars, namely HD 12484 and HIP 65407, show detectable chromospheric emissions. They are the only two among the eight stars to have above −4.7 and are considered here as active. According to Santos et al. (2000b), their levels of activity should induce stellar jitters of about 20 and 10 m/s, respectively. The low activity levels of the six remaining stars imply stellar jitters of a few m/s at most.
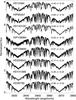 |
Fig. 3 H and K Ca ii lines of the eight planet-host stars on the averaged SOPHIE spectra. The stars are sorted by increasing activity from bottom to top, with the |
According to Noyes et al. (1984) and Mamajek & Hillenbrand (2008), these levels of activity imply stellar rotation periods Prot of around 11, 7, and 20 days for HD 143105, HD 12484, and HIP 65407, respectively, and between 20 and 60 days for the five less active stars. The uncertainties related to these Prot estimations are difficult to quantify. Those reported in Table 2 are estimates that take the uncertainties on our measured and a ± 0.16 uncertainty on the Rossby numbers into account (Mamajek & Hillenbrand 2008). These estimates of stellar rotation periods roughly agree with the upper limits derived from the v sin i⋆ (Bouchy et al. 2005a) except for HIP 109600, HIP 109384, and HD 141399. They are different from the orbital periods measured below for the planets, which means that there are no hints that the periodic signals in radial velocities could be due to stellar activity modulated by stellar rotation. One possible exception is the inner planet of HIP 65407, which is discussed below in Sect. 5.1.2.
Stellar activity could also cause low-frequency radial velocity variations through magnetic cycles (see, e.g., Wright et al. 2008; Fares et al. 2009; Moutou et al. 2011; Carolo et al. 2014). For active stars, this can induce radial velocity variations of up to 20 to 30 m/s. The shortest known magnetic cycles have periods of about two years and most of them are longer (22 years for the Sun). The periodicities we report below for our two active stars are shorter than 100 days; they are therefore unlikely to be due to magnetic cycles. Magnetic cycles have also been identified in inactive stars, with amplitudes of up to a few m/s (Lovis et al. 2011). Four of our six inactive stars show periodicities shorter than 240 days and are therefore unlikely to be caused by magnetic cycles. Our two remaining inactive stars (namely HIP 109384 and HD 141399) show radial velocity variations with longer periods. According to Lovis et al. (2011), the amplitude of their magnetic cycles is on the order of 1 m/s or below. Thus, magnetic cycles are unlikely to cause the stronger variations we report.
Fitted Keplerian orbits and planetary parameters for the six single-planet systems, with 1σ error bars.
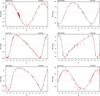 |
Fig. 4 Phase-folded radial velocity curves for the six stars with a single-planet detection. The SOPHIE data obtained before and after the June-2011 upgrade are plotted in blue and red with 1σ error bars, and the Keplerian fits are the solid lines. The orbital parameters corresponding to the Keplerian fits are reported in Table 3. For HD 220842 the linear drift is subtracted here. The HD 143105b transit detection attempt of 2013-09-17 is shown around φ = 0.25. |
4. Single-planet systems detection and characterization
4.1. Method
We describe here the orbit analyses of the six stars that only present a single characterized planet: HD 143105, HIP 109600, HD 35759, HIP 109384, HD 220842, and HD 12484. For each of them the radial velocities present periodic variations that were previously identified since the first about 10 - 20 SOPHIE spectra were obtained. The following measurements allowed the periods to be confirmed and the parameters to be refined for each object. We fit the six final radial velocity sets with single Keplerian orbits using the procedure yorbit (Ségransan et al. 2011; Bouchy et al. 2016). The six parameters of the orbits were free to vary during the fits. For objects with both SOPHIE and SOPHIE+ data, we introduced one additional free parameter to take the possible radial velocity shift between the two datasets into account. The radial velocity shifts we found (see below) agree with the values found by Moutou et al. (2014) and Wilson et al. (2016) between SOPHIE and SOPHIE+ (but see the particular case of HIP 109384 in Sect. 4.5). Finally, we allowed radial velocity linear drifts in addition to the Keplerian motions, which added one additional free parameter for each object. Only one significant drift was detected (at more than 3σ) for HD 220842. The free shift between SOPHIE and SOPHIE+ is unlikely to hide any possible actual stellar drift, except maybe for HIP 109384 (Sect. 4.5).
Lomb-Scargle periodograms of the datasets show clear peaks at the periods of each orbit. Some additional peaks are also visible, corresponding to aliases or secondary lobes that are due to the sampling. The additional peaks all present lower power than the main peaks, and Keplerian fits at these periods are clearly less accurate than the Keplerian fits made at the periods corresponding to the main peaks. This means that there are clearly no ambiguities in the periods of the six detected planets. Periodograms of the radial velocity residuals after Keplerian fits show no significant peaks. The current data show no significant detections of more companions in addition to the six single planets presented here, with the exception of the linear drift detected in HD 220842.
The derived orbital parameters of the six single planets are reported in Table 3 together with error bars, which were computed from Monte Carlo and residual permutation experiments that were both based on error bars on each radial velocity measurement. They provide similar error bars with no significant asymmetries or skews. We finally adopted the most conservative uncertainties. Table 3 includes the orbital period P, the eccentricity e, the argument of periastron ω, the time T0 at periastron (or time of possible transits for circular or nearly circular orbits of HD 143105b and HD 12484b), the semi-amplitude K, the sky-projected mass of the planet Mp sin i, the semi-major axis a, the systemic radial velocities Vr, the number N of radial velocities and their time span, the dispersion σO−C of the residuals to the Keplerian fit, and the additional radial velocity drift (or its limit). The uncertainties on Mp sin i and a are mainly due to the uncertainties on the host-star masses. The fits and their residuals are plotted as a function of time in the six upper panels of Fig. 2; the phase-folded plots are displayed in Fig. 4.
The Keplerian fits of the radial velocities provide measurements of the sky-projected mass Mp sin i of the planetary companions, while the inclination i of the orbit remains unknown. High masses for the companions could not formally be excluded from the radial velocities in cases of particularly small inclinations. To identify possible face-on systems, we searched for signatures of orbital motion in Hipparcos astrometric data. Our stars have each between 100 and 150 Hipparcos measurements covering several periods of each planet, with a typical accuracy of a few mas. They were fitted with five-parameter models using the orbital parameters obtained from the radial velocities, following the method described in detail by Sahlmann et al. (2011). This method has proven to be reliable in detecting astrometric orbital signatures (e.g., Sahlmann et al. 2011, 2013; Díaz et al. 2012; Wilson et al. 2016). Here we detected no orbital motions. The corresponding upper limits Mp max on the companion masses are reported in the bottom line of Table 3; they do not put strong constraints. Any companion with a true mass of around one solar mass or higher would have been detected as a secondary peak in the CCFs or as a variation in their bisectors, which is not the case here. We can conclude here, however, that none of our companions is an obvious binary in a face-on system.
The six single planetary systems are discussed below.
4.2. HD 143105
4.2.1. Keplerian fit
HD 143105 (BD + 69°825, HIP 77838) is a rotating star (v sin i⋆ = 9.1 ± 1.0 km s-1), but does not show a high activity level ( ). Simbad classifies it as an F5 star, but our temperature measurement (Teff = 6380 ± 60 K; Sect. 3) suggests the slightly later spectral type F7. We started observing it in July 2013, after the SOPHIE+ upgrade. The star rapidly showed the typical signature of a hot Jupiter, with a variation of K ~ 150 m/s and a period near 2.2 days. We followed this star for 14 months to confirm the detection, constrain the properties of the system, and detect any possible additional companion. The final dataset includes N = 100 radial velocity measurements that we fit with Keplerian models. They did not provide a significant detection of any eccentricity: we measured e = 0.021 ± 0.016 and ω = 40 ± 70°. The 3σ upper limit we derived is e< 0.07. In agreement with the data and the expectation that hot Jupiters are circularized, we assumed a circular orbit for the final fit. The derived radial velocity semi-amplitude is K = 144.0 ± 2.6 m/s corresponding to a mass Mp sin i = 1.21 ± 0.06 MJup. The planet HD 143105b orbits a slightly metal-rich star, in agreement with the tendency found for stars harboring Jupiter-mass planets (see, e.g., Santos et al. 2005).
The residuals around the Keplerian fit show a dispersion of 10.6 m/s. This quite high value is not due to the activity level of the star, which is low, nor to the assumption of a circular orbit. This dispersion is mainly explained by the uncertainties of the radial velocities, which are 9.2 m/s on average. The relatively low level of radial velocity accuracy obtained for this star by comparison to the other stars is due to the broadening of the lines caused by the stellar rotation. Moreover, HD 143105 is the hottest of the eight stars studied here, and granulation effects might be higher. No significant linear drift or particular structures were found in the residuals as a function of time.
4.2.2. Transit search
Following 55 Cancri, HD 143105 is the second brightest star known to host a planet with a period shorter than three days (55 Cancri e is a super-Earth). Since HD 143105 is bright and the transit probability is as high as 14% for its hot Jupiter, this system was particularly interesting for photometric follow-up studies. After the first SOPHIE observations of this star in July 2013, which rapidly showed that it hosts a hot Jupiter, we therefore started a transit search the following month using three different telescopes: Oversky, CROW, and ROTAT.
The Oversky Observatory (35 cm f/11 Schmidt-Cassegrain) telescope observations unfortunately met bad weather and the photometry was unusable to constrain any transit model. The CROW observatory in Portugal (28 cm f/10 Schmidt-Cassegrain, KAF1603ME CCD, 25 s exposures, Ic filter, defocused images) produced three photometric series on August 15 and 26, and September 17, 2013. The dispersions are 4.0, 3.7, and 4.6 mmag, respectively, and 2.3, 2.1, and 2.7 mmag when data are binned to have a point approximatively every 120 s. The ROTAT telescope at OHP (60 cm f/3.2 Newton, KAI11000M CCD) was also used for three nights in 2013: August 26 (4 s exposures, luminance filter, defocused images), September 6 (20 s exposures, R filter, defocused images), and September 17 (4.5 s exposures, luminance filter, defocused images). On September 6, the dispersion was 10.7 mmag, and 7.8 mmag when binned to have a point approximatively every 120 s. On September 17, cirrus clouds were present sometimes, and the dispersion was 20.1 mmag, and 8.1 mmag when binned.
The light curves are shown in Fig. 5 (upper panel). Differential photometry was measured and the data were detrended with smooth second-order polynomials. Assuming a stellar radius 1.15 R⊙ typical of an F5V star, values for a and P from Table 3, and a central transit (impact parameter b = 0), we evaluate the transit maximum duration to ~2.37 h, which is between transit phases −0.022 and + 0.022. The uncertainty on the epoch of each transit mid-time is on the order of ± 10 min (see Table 3). A slight drop of about 15 mmag has been observed with ROTAT for about one hour on August 26 at the expected time of transit (these data were not detrended because they show this feature). Outside that event, the dispersion is 7.3 mmag, or 3.1 mmag when binned. Comparison stars (significantly fainter) do not show such an event, therefore the indication of a transit detection was strong. However, this event has not been observed at the other dates. Even more, the CROW observation secured on August 26 did not show the feature seen with ROTAT the same night. We therefore conclude that no transit deeper than 10 mmag was detected. The event observed with ROTAT remains unexplained. This might be a sporadic event due to stellar activity accidentally occurring at the time of a possible transit.
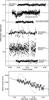 |
Fig. 5 Search for transits of HD 143105b. Top: photometry. The differential photometry is plotted as a function of the phase of the searched transits. The telescopes (CROW or ROTAT) and the dates are indicated for each of the six observations, which have been shifted in y-axes for clarity. The horizontal lines represent the mean of the data (or mean outside the event for 2013-08-26 with ROTAT). The original data (plus signs) have been binned to have a point approximatively every 120 s (diamond signs) to facilitate the comparison. The vertical dashed lines represent the hypothetical ingress, center, and egress phases for central transits. The transit-like event observed on 2013-08-26 with ROTAT was not confirmed by other observations. Bottom: spectroscopy. SOPHIE radial velocities measured during a possible transit (2013-09-17). The expected Rossiter-McLaughlin anomaly is shown as a dotted line (for an aligned, prograde orbit); it is not detected. The solid line shows the Keplerian model with no transit (Figs. 2 and 4, Table 3). |
On September 17, the reality of the transit was still unclear, therefore we attempted a spectroscopic detection of the transit with SOPHIE through the Rossiter-McLaughlin effect (e.g., Hébrard et al. 2011). As the star is rotating (v sin i⋆ = 9.1 ± 1.0 km s-1), the amplitude of the Rossiter-McLaughlin anomaly is expected to be as high as ~100 m/s and thus easily detectable. No deviation from the Keplerian curve was detected during this night, however (see upper left panel of Fig. 4 and lower panel of Fig. 5). This means that even if a transiting planet on a polar orbit and a null -impact parameter would produce no Rossiter-McLaughlin signal, this scenario remains unlikely and we conclude that the planet is not transiting. The radial velocities obtained during the night of September 17 are used in the Keplerian fit presented above in Sect. 4.2.1.
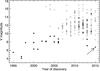 |
Fig. 6 Magnitudes of known hot-Jupiter host stars as a function of the planet discovery year. Transiting systems are empty symbols, non-transiting systems detected only in radial velocities are filled. Hot Jupiters are selected from exoplanets.org as planets with masses >0.2 MJup and periods <6 days (220 planets). The host star of the new hot Jupiter HD 143105b is indicated with an arrow. |
4.2.3. Hot Jupiters around bright stars
With a magnitude mv = 6.75, HD 143105 is one of the brightest stars known to host a hot Jupiter. Figure 6 shows the V magnitudes of hot-Jupiter host stars as a function of the year of their discovery, distinguishing transiting planets from those only characterized from radial velocities. Here hot Jupiters are defined as planets with Mp sin i> 0.2 MJup and orbital periods shorter than six days, as suggested by mass and period distributions of known planets. In the continuation of the three first discovered hot Jupiters, 51 Peg b, Tau Boo b, and Ups And b (Mayor & Queloz 1995; Butler et al. 1997), the first decade of radial velocity surveys allowed about a dozen hot Jupiters to be discovered around stars brighter than V = 8. Three of them afterward turned out to transit, namely HD 209458b, HD 189733b, and HD 149026b (Charbonneau et al. 2000; Bouchy et al. 2005b; Sato et al. 2005). The transits in front of these three bright stars allowed numerous and important follow-up studies. The second decade allowed many hot Jupiters to be detected directly in transit from ground- and space-based photometric surveys in front of fainter stars. Figure 6 shows that radial velocity surveys still continue to detect hot Jupiters in front of bright stars, which clearly means that they are not all known as of yet. The transit probability being around 10% for a hot Jupiter, transiting hot Jupiters may still be discovered in front of bright stars, which would be of high interest for follow-up studies. They could be detected from radial velocity surveys, or later from the future TESS and PLATO satellites. It is possible that HD 143105b has been missed by some previous radial velocity surveys if they avoided observing fast rotators. As shown here, however, a stellar rotation of about v sin i⋆ ~ 9 km s-1 does not prevent a hot Jupiter detection from radial velocities at all.
Orbiting a bright star, HD 143105b will be a precious object for follow-up studies in various spectral domains despite its non-transiting nature. If the planet has a grazing incidence, it may be possible to detect the partial transit of an evaporating atmosphere in the ultraviolet, extended by the high irradiation from the F-type host star (see the case of 55 Cnc b; Ehrenreich et al. 2012). The inclination of the HD 143105b orbit could be constrained by measuring the polarization of its optical phase curve (Madhusudhan & Burrows 2012). Such measurements are challenging in the optical (e.g., Charbonneau et al. 1999; Leigh et al. 2003) where hot Jupiters usually have low albedos and yield faint signals. A tentative detection of phase variations from the non-transiting Saturn-mass planet HD 46375b was nonetheless obtained from CoRoT observations in the optical (Gaulme et al. 2010). Because the mass of HD 143105b is higher and it orbits a brighter star at a similar orbital distance, its reflected light will probably be measurable at visible wavelengths with ultra-high precision photometry, for instance, with the future CHEOPS satellite. Despite the degeneracy caused by the absence of transit (the amplitude of the modulation varies as the product of the planet surface and geometric albedo), the shape and offset of the phase curve could reveal the composition and structure of the atmosphere (see, e.g., Seager et al. 2000; Showman & Guillot 2002; Heng & Demory 2013). It might already be possible to analyse the light reflected by the HD 143105b atmosphere through cross-correlating high-resolution optical spectra, constraining the planet orbital inclination and its true mass (Martins et al. 2013, 2015). High-resolution spectra of the HD 143105b thermal emission from the dayside could be obtained in the future with infrared instruments such as SPIRou at CFHT or JWST. The identification of individual molecular lines in the infrared would then set further constraints on the thermal structure, the circulation, and composition of the atmosphere (e.g., Brogi et al. 2012; Snellen et al. 2014).
4.3. HIP 109600
The star HIP 109600 (BD + 28°4312) was observed before and after the SOPHIE upgrade. We finally secured 34 measurements. The 232-day period is obvious in the time series, and no significant drift is detected over the nearly seven years of observation. The residuals of the Keplerian fit show dispersions of 9.6 and 3.3 m/s for SOPHIE and SOPHIE+, respectively, in agreement with the typical uncertainties of their measurements. SOPHIE data are redshifted by 33.6 ± 1.1 m/s by comparison to SOPHIE+.
The semi-amplitude is K = 98.6 ± 0.5 m/s, which corresponds to Mp sin i = 2.68 ± 0.12 MJup. HIP 109600b is a giant planet orbiting a G5V star in P = 232.08 ± 0.15 days with a low but significant eccentricity of e = 0.163 ± 0.006. Its orbit is thus located on a temperate orbit, with an insolation level of around 1.5 ± 0.3 that of Earth on its orbit. The habitable zone around a star can be defined as the area where the insolation level would be between 0.2 and 1.8 that of Earth (e.g., Kopparapu et al. 2013; Jenkins et al. 2015). Any possible satellite orbiting HIP 109600b might therefore be habitable. The presence of such satellites remains beyond the reach of present techniques, unfortunately. We also note that HIP 109600 is metal-poor ([ Fe / H ] = −0.12 ± 0.02), whereas most giant-planet hosts are metal-rich.
Several studies have shown that the Keplerian signature of a single eccentric planet might also be fit with a model including two planets on circular (or nearly circular) orbits in 2:1 resonance, depending on the radial velocity accuracy and their time sampling (e.g., Anglada-Escudé et al. 2010; Wittenmyer et al. 2013; Kürster et al. 2015). Numerous pairs of planets near the 2:1 orbital resonance have indeed be detected in transit with Kepler (e.g., Lissauer et al. 2011; Delisle & Laskar 2014). Here, adding an inner planet with a period half of that of HIP 109600b provides a fit with a similar residual dispersion as the one-planet fit adopted above. This means that comparing the residual dispersion does not allow us to exclude the presence of an inner planet with a period of ~117 days and a semi-amplitude K = 16 ± 2 m/s corresponding to Mp sin i = 0.35 ± 0.04 MJup. Adding this inner planet would not significantly change the parameters of HIP 109600b, except that its orbit would then be circular.
To compare the above one- and two-planet Keplerian models in more detail, we computed their Bayesian evidence using the methods of Chib & Jeliazkov (2001) and Perrakis et al. (2014) (see also Díaz et al. 2016b). Both methods produce similar results, but the dispersion of Chib & Jeliazkov (2001) is much smaller. We found that the one-planet model is 21.9 ± 0.8 times more probable, therefore we finally adopted this solution.
4.4. HD 35759
We started observing HD 35759 (BD + 64°532, HIP 25883) in September 2011, a few weeks after the SOPHIE+ upgrade. Seventy-one radial velocities were finally acquired. Their Lomb-Scargle periodogram shows a clear peak at 82.5 days, as well as a weaker peak at the harmonic corresponding to half the period. There are no ambiguities on the true period of the signal, however, which is measured to be 82.467 ± 0.019 days.
The Keplerian fit of the radial velocities provides a semi-amplitude K = 173.9 ± 1.3 m/s corresponding to a mass Mp sin i = 3.76 ± 0.17 MJup. The eccentricity is significantly detected to be e = 0.389 ± 0.006. HD 35759b therefore is a giant planet orbiting a G5V star with a period similar to that of Mercury, but with a higher eccentricity.
The residuals of this fit show a dispersion of 6.0 m/s, in agreement with the typical accuracy of the measurements. Adding an inner planet in a circular orbit of half that period significantly degrades the fit, providing a residual dispersion above 20 m/s. Moreover, we detect no significant drift for the 3.5 years of observation. This means that there are no hints for any additional inner or outer companion in this system.
4.5. HIP 109384
We observed the G5V star HIP 109384 (BD + 70°1218) for more than seven years, before and after the SOPHIE upgrade. The final dataset includes 42 measurements. The periodic signal with a period near 500 days clearly appears in the data. The residuals of the one-planet Keplerian fit are 3.7 and 5.8 m/s, in agreement with the uncertainties on the individual measurements with SOPHIE and SOPHIE+, respectively. The dispersion is surprisingly larger for data secured after the upgrade, but only seven measurements were secured before the upgrade. The SOPHIE data are redshifted by 6.7 ± 0.5 m/s by comparison to SOPHIE+, which is a small shift when compared to other systems that were observed before and after the upgrade, in the present study and in Moutou et al. (2014) or Wilson et al. (2016). This might be the signature of an additional drift due to another companion in the system, but the current data do not allow this to be confirmed. The Keplerian fits made with or without this drift provide similar parameters for the planet HIP 109384b. Adding a circular inner planet with a period near 250 days (half the period of HIP 109384b) provides a significantly poorer fit with a residual dispersion of 12 m/s for the SOPHIE+ data, which means that there are no hints for such an inner additional planet in 2:1 resonance.
HIP 109384b has a mass Mp sin i = 1.56 ± 0.08 MJup (K = 56.53 ± 0.22 m/s) and a period of 499.48 ± 0.32 days. Its host star is metal-poor ([ Fe / H ] = −0.26 ± 0.03). The orbit is eccentric with e = 0.549 ± 0.003. In addition to the main signal of HIP 109384b, the Lomb-Scargle periodogram shows a weak peak near 10 days that is still visible in the residuals of the one-planet fit. No corresponding peaks are seen in the periodograms of bisectors, width, or . The residuals could be fitted at this period with an amplitude K ≃ 6 m/s, corresponding to about one Neptune mass; this weak signal is not significant in our data, however, therefore we do not claim such a detection. We will continue observing that star to study this signal as well as the possible drift. The presence or absence of such an additional inner or outer planet does not significantly change the parameters of the giant planet HIP 109384b.
From the periastron and apoastron of its eccentric orbit, the insolation levels of HIP 109384b are estimated to lie between 0.4 ± 0.1 and 0.6 ± 0.1 of the Earth’s insolation. This places HIP 109384b in the outer part of its habitable zone, making any satellite particularly interesting that might orbit this giant planet.
4.6. HD 220842
We started observing the F8V, inactive, metal-poor star HD 220842 (BD + 56°3009, HIP 115714) in June 2012, one year after the SOPHIE upgrade. The dataset includes 42 radial velocity measurements spread over 2.7 years. They display large variations that can be fit with a Keplerian orbit with a 218-day period. Figure 2 might suggest that this period mainly stands on one point (at BJD = 2 456 847.6) and that a single planet on a period twice longer (about 440 days) could fit the data as well if that point were omitted. However, fits without this point and with a double period clearly show a larger dispersion in their residuals, and we found no reasons to omit this point.
The final fit provides a period of 218.47 ± 0.19 days and a semi-amplitude K = 108.1 ± 1.2 m/s corresponding to a mass of Mp sin i = 3.18 ± 0.15 MJup. The residuals show a dispersion of 4.5 m/s in agreement with the accuracy of the measurements. The orbit is eccentric with e = 0.404 ± 0.009. Including an additional circular planet with a period near 109 days (half the period of HD 220842b) provides a significantly poorer fit with a residual dispersion of 13 m/s, which means that there are no hints for such an inner resonant planet.
In addition to the one-planet Keplerian model, the data clearly show another drift revealing the presence of a second companion to the star, which could be stellar or planetary. There are no indications of binarity for this star in the literature. A linear trend is enough to fit the drift, and we obtain −35.5 ± 1.0 m s-1 yr-1. Assuming an eccentricity of e ≃ 0.5 for this additional companion, it would correspond to a period of at least ~1100 days and a projected mass of at least ~2.1 MJup. Solutions with longer periods and higher masses are also allowed from the data, as well as different values for the eccentricity. We will continue to follow this system with SOPHIE to characterize the second component, and in particular to determine whether it is a planet or a star.
To search for the companion at the origin of the drift, we observed HD 220842 with the Subaru Coronagraphic Extreme Adaptive Optics system (SCExAO; Jovanovic et al. 2015). SCExAO is a high-performance, high-contrast imager which employs advanced wavefront control and sophisticated coronagraphs at the 8 m Subaru Telescope in Mauna Kea. HD 220842 was observed for 20 min on November 1, 2015, in field rotation mode and without a coronagraph. The angular differential imaging data were reduced using GRAPHIC (Hagelberg et al. 2016). No companion was detected in the resulting data, but an upper limit on the putative companion can be derived from the detection limit (Fig. 7). The detection limit was generated following a similar procedure as in Chauvin et al. (2015), while the mass estimates are based on the BT-SETTL models (Allard et al. 2014) using a conservative age estimate of 5 Gyr for the system. Assuming that the companion was not hidden below or in front of the star at the time of our observation, we can exclude at 5σ that the companion is more massive than 20 MJup with a period shorter than ~230 years (a ~ 60 AU), or more massive than 40 MJup with a period shorter than ~75 years (a ~ 20 AU). We therefore conclude that the companion at the origin of the linear drift is probably substellar. Future observations could reinforce this conclusion if the companion remains undetected at different epochs. Deeper observations than the snapshot we have obtained may be able to directly detect the companion.
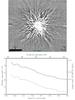 |
Fig. 7 Subaru/SCExAO ADI observation of HD 220842 in H band (upper panel). No candidate has been resolved in this snapshot. The lower panel shows the corresponding upper limits on the companion producing the radial velocity drift of HD 220842. Detection limits at 1 and 5σ are plotted as dashed and solid lines, respectively. The mass estimate is based on BT-SETTL CIFIST2011 models (Allard et al. 2014). The contrast curve has been corrected to take self-subtraction into account. Companions above the solid line would have been detected at more than 5σ. |
4.7. HD 12484
The F8V star HD 12484 (BD + 02°320, HIP 9519) was observed with SOPHIE+ from September 2012 to January 2015. The final dataset includes 65 radial velocities with a typical accuracy of 10 m/s. The moderate level of accuracy is due to the broadening of the lines caused by the rotation of the star (v sin i⋆ = 8.2 ± 1.0 km s-1). This F8V star is active with chromospheric emissions in the H and K lines (Fig. 3) corresponding to 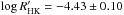 . Despite this high level of activity, which implies stellar jitter, a periodic signal is clearly detected in the data. The one-planet Keplerian fit provides a period of 58.83 ± 0.08 days and a semi-amplitude K = 155 ± 5 m/s corresponding to Mp sin i = 2.98 ± 0.14 MJup. No significant eccentricity is detected, and we obtained the formal value e = 0.07 ± 0.03. Because the period is outside the domain range of hot Jupiters, there are no reasons to fix the orbit as circular, and we let the eccentricity free in the fit.
The dispersion of the fit residuals is 25.2 m/s, which is larger than the accuracy of the data. They agree with the stellar jitter of ~20 m/s expected for an F-type star at this level of activity, however (Santos et al. 2000b). Figure 8 shows the clear anticorrelation between the bisector spans and the radial velocity residuals after the Keplerian fit, which is the typical signature of variations induced by stellar activity (Queloz et al. 2001; Boisse et al. 2009). We therefore conclude that the additional noise in the radial velocities is due to the stellar activity of HD 12484. No periodic signals were detected in the residuals, even when we considered only short time spans of data. The rotation period deduced from the activity level of the star is Prot ≃ 7 ± 4 days. It is different enough from the orbital period of the planet to assume that the activity noise does not significantly perturb the parameters of the planet. Indeed, the parameters are deduced from the Keplerian model, which considers the stellar jitter as an uncorrelated noise, which is not necessary the case here.
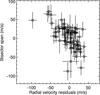 |
Fig. 8 Bisector span as a function of the radial velocity residuals after the Keplerian fit for HD 12484. The clear anticorrelation indicates that the residuals are mainly due to the stellar activity. |
The inclination of the orbit being unknown, the transit probability of HD 12484b is ~1.5%. Of the new single planets presented here, this is the second highest transit probability after the hot Jupiter HD 143105b (Sect. 4.2). The four other single planets presented above have transit probabilities included between 0.5 and 1.0%. HD 143105b is the only one for which we have attempted a transit detection up to now.
Adding an inner planet with half the orbital period of HD 12484b provides a fit with a similarly high residual dispersion of 25 m/s. This dispersion comparison does not exclude an inner planet with a period of ~29 days and semi-amplitude K = 15 ± 5 m/s around HD 12484, corresponding to Mp sin i = 0.22 ± 0.08 MJup. However, a Bayesian evidence comparison for both models (see Sect. 4.3) indicates that the one-planet model is 7.8 ± 0.5 times more probable than the two-planet model. There is no evidence for the presence of such a speculative inner resonant planet, and we adopt the one-planet model for HD 12484.
Active stars known to host planets are rare. This probably is a selection bias. Indeed, the stellar jitter caused by activity makes them unfavorable objects to detect planets, therefore they are frequently excluded from radial velocity surveys that search for extrasolar planets. Only a few planetary systems are known around stars with  . They include hot Jupiters such as WASP-52b, 59b, or 84b (Hébrard et al. 2013; Anderson et al. 2014), giant planets on longer periods such as HD 192263b, GJ 3021b, and HD 81040b (Santos et al. 2000a; Naef et al. 2001; Sozzetti et al. 2006), or the multi-planet systems around HD 128311 and HD 9446 (Vogt et al. 2005; Hébrard et al. 2010). The new giant planet HD 12484b increases this population.
5. Multi-planet systems detection and characterization
The two last systems presented in this paper show signatures of multi-planet systems: two planets around HIP 65407 and four around HD 141399. They add new cases to the few systems hosting several giant planets, whereas most of the low-mass planets are in multiple systems. Of the 535 systems from exoplanets.org known to include planet(s) with masses higher than 0.3 MJup, only 50 are multiple. After detection-bias corrections, Mayor et al. (2011) reported multi-planet rates of 26% for giant planets and over 70% for planets below 0.1 MJup.
We fit the datasets of the two multiple systems and determined the uncertainties on their parameters using the same Keplerian procedure as above for singe planets (Sect. 4.1), with five more free parameters per additional planet. These Keplerian analyses do not take any gravitational interactions between planets into account, which could be significant in some cases. We therefore subsequently complement the purely Keplerian analyses by additional dynamical studies and compare the results of the two approaches. Our different analyses of the two multi-planet systems are discussed below.
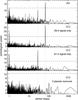 |
Fig. 9 Lomb-Scargle periodograms of the SOPHIE radial velocities of HIP 65407. Upper panel: periodogram computed from the radial velocities with all fits. The second and third panels show the periodograms computed from the residuals of the fits that only include HIP 65407b or HIP 65407c, respectively. Bottom panel: periodogram after subtracting the two-planet fit. The two vertical dotted lines show the periods of the two planets. The horizontal dashed lines correspond to the false-alarm probability of 1 × 10⁻³. |
5.1. HIP 65407
5.1.1. Planets detection
We obtained 65 radial velocity measurements of HIP 65407 (BD + 49°2212) over more than four years, both with SOPHIE and SOPHIE+. The data soon revealed the signature of two periodic variations in the planet-mass range, which were confirmed by subsequent SOPHIE observations.
Figure 9 shows Lomb-Scargle periodograms of the measurements and residuals of HIP 65407. In the upper panel of Fig. 9, which presents the periodogram of the radial velocities of HIP 65407, periodic signals at 28 days and 67 days are clearly detected, with peaks at the periods corresponding to the two planets. The peaks at about one day correspond to the aliases of both detected signals, as the sampling is as usual biased with the night and day succession.
In the second panel of Fig. 9 we plot the periodogram of the residuals after subtracting a fit including only the 28-day-period planet. The peak at 67 days is visible in these residuals. In the same manner, the third panel of Fig. 9 shows the periodogram of the residuals after a fit including only the 67-day-period planet. The peak at 67 days is no longer visible, and this time, the peak at 28 days is visible. The bottom panel of Fig. 9 shows the periodogram of the residuals after subtracting the Keplerian fit including both HIP 65407b and HIP 65407c. There are no remaining strong peaks in this periodogram; even the one-day alias disappeared, showing that most of the periodic signals have been removed from the data. False-alarm probabilities of 1 × 10⁻³ are also reported in Fig. 9; they are based on bootstrap experiments and comparisons of periodogram peaks of all periodograms obtained for each radial velocity permutation.
This periodogram analysis shows that the two planets are clearly detected in our data with unambiguous periods and that there are no significant additional periodic signals. In particular, there are no signs of additional planets at longer periods in the time span of our data (more than four years), which is also seen by the fact we do not detect any significant linear drift in the radial velocities in addition to the signature of the two planets.
Fitted Keplerian orbits and planetary parameters for the two multi-planetary systems, with 1σ error bars.
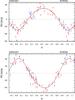 |
Fig. 10 Phase-folded radial velocity curves for HIP 65407b (P = 28.1 d, top) and HIP 65407c (P = 67.3 d, bottom) after removing the effect of the other planet. The SOPHIE data obtained before and after the June-2011 upgrade are plotted in blue and red with 1σ error bars, and the Keplerian fits are the solid lines. Orbital parameters corresponding to the fits are reported in Table 4. |
5.1.2. Keplerian fit
The radial velocities were first fit with a Keplerian model, that is, neglecting any possible gravitational interactions between the two planets. The two-planet Keplerian best fit is plotted in Fig. 2 as a function of time (lower left panel) and in Fig. 10 as a function of the orbital phase. The different phases of the two orbits are well covered by our observations. The derived parameters are reported in Table 4. The inner planet, HIP 65407b, produces radial velocity variations with a semi-amplitude K = 30.5 ± 1.6 m/s corresponding to a planet with a minimum mass Mp sin i = 0.428 ± 0.032 MJup. Its orbit has a period of 28.125 ± 0.019 days and no significant detection of any eccentricity (e = 0.14 ± 0.07). The outer planet, HIP 65407c, yields a semi-amplitude K = 41.5 ± 1.9 m/s corresponding to a planet with a projected mass Mp sin i = 0.784 ± 0.054 MJup. The orbital period is 67.30 ± 0.08 days, and there is a hint of a possible weak eccentricity detection (e = 0.12 ± 0.04). No astrometric motions corresponding to these planets were detected in the Hipparcos data (Sect. 4), in agreement with the non-detection of any secondary peak in the CCFs. The derived upper limits Mp max on the planetary masses are above one solar mass and thus not constraining.
SOPHIE data are redshifted by 20.0 ± 5.8 m/s by comparison to SOPHIE+. There are mainly SOPHIE+ data for this system, and their residuals show a better dispersion (7.5 m/s) than the SOPHIE residuals (11.9 m/s). This dispersion is slightly larger than the one expected for SOPHIE+. This may be partly due to stellar jitter as the host star is active. Its 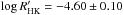 could imply stellar jitter on the order of 10 m/s (Sect. 3). In addition, the period of the inner planet (28.125 ± 0.019 days) is just slightly longer than the stellar rotation period, roughly estimated in Sect. 3 to be 19 ± 7 days. Confusions between stellar activity signals and Doppler wobble due to the planet might be suspected here. We note, however, that the bisectors show no significant variations, periodicity, or correlation as a function of the radial velocities or as a function of the radial velocity residuals after fits including both planets or just one of them. Such a correlation could have been the signature of changes in the stellar line profiles due to the activity of the star, as in the case of HD 12484 (Sect. 4.7). We do not see any significant periodicities in the periodograms of Fig. 9 in addition to those of the two planets. This could have been the signature of stellar rotation. This means that although the star is active, we detect no significant signs of stellar jitter in our radial velocity data, except possibly dispersion residuals that are slightly higher than expected. Moreover, the parameters of both planets are stable over the more than four years of observations; they also remain unchanged when only short-time sequences are analyzed instead of the whole dataset. Together with the absence of periodicities in the periodograms of other activity indicators such as the width of the CCF or the index, it is thus unlikely that the activity of the star significantly affects the orbital parameters that we derived from their Keplerian fit. These parameters therefore appear to be reliable.
The transit probabilities for HIP 65407b and HIP 65407c are ~2.6% and ~1.3%, respectively. We did not attempt any transit detection for them up to now.
As the system shows a planetary system composed of two planets in compact orbits, we assess below the gravitational interactions between the two planets to evaluate their possible effects and differences with the Keplerian fit, which assumes that the two planets do not interact. The stability of the system is not straightforward since the minimum masses of the planets are on the same order as the mass of Jupiter. As a consequence, mutual gravitational interactions between planets may give rise to some instabilities.
5.1.3. Secular coupling
The ratio between the orbital periods determined by the Keplerian fit (Table 4) is Pc/Pb = 2.4, which is close to a 12:5 mean motion resonance. We performed a frequency analysis of the Keplerian orbital solution listed in Table 4 computed over 10 kyr. The orbits of the planets were integrated with the symplectic integrator SABAC4 of Laskar & Robutel (2001), using a step size of 0.01 yr. We conclude that despite the proximity of the 12:5 mean motion resonance, the two planets in the HIP 65407 system are not trapped inside, at least when we adopt the minimum values for the masses.
The fundamental frequencies of the systems are then the mean motions nb and nc and the two secular frequencies of the periastrons g1 and g2 (Table 5). Because of the proximity of the two orbits, there is a strong coupling within the secular system (see Laskar 1990). Both planets HIP 65407b and HIP 65407c precess with the same precession frequency g1, which has a period of 206 years. The two periastrons are thus locked and Δω = ωc − ωb oscillates around 180° (anti-aligned ellipses) with a maximal amplitude of about 45° (see Fig. 11).
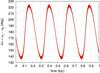 |
Fig. 11 Evolution in the HIP 65407 two-planet system of the angle Δω = ωc − ωb (red line), which oscillates around 180° with a maximal amplitude of 45°. The green and black lines (nearly overplotted) also give the Δω evolution, but obtained with the linear secular models (Eqs. (1) and (2), respectively). |
To present the solution in a clearer way, it is useful to make a linear change of variables into eccentricity proper modes (Laskar 1990). In the present case, the linear transformation is numerically obtained by a frequency analysis of the solutions because of the proximity of the 12:5 mean motion resonance and the possibly eccentric orbits. Using the classical complex notation zp = epeiωp, for p = b,c, we have for the linear Laplace-Lagrange solution 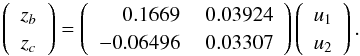 (1)The proper modes uk (with k = 1,2) are obtained from the zp by inverting the above linear relation. To good approximation, we have uk ≈ ei(gkt + φk), where gk and φk are given in Table 5. From Eq. (1), the meaning of the observed libration between the periastrons ωb and ωc can be understood. For both HIP 65407b and HIP 65407c, the dominant term is u1 with frequency g1, and they therefore both precess with an average value of g1 (green line in Fig. 11).
Equations (1) usually also provide a good approximation for the long-term evolution of the eccentricities. In Fig. 12 we plot the eccentricity evolution with initial conditions from Table 4. Simultaneously, we plot the evolution of the same elements given by the above secular linear approximation with green lines. We see, however, that there is a small deviation from the linear approximation. Returning to the decomposition of zp in the proper modes, we note an additional forcing frequency at 2g1 − g2 with significant power. We can correct the linear Laplace-Lagrange solution (Eqs. (1)) to include the contribution from this term as 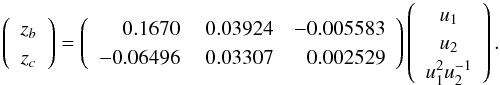 (2)In Figs. 11 and 12 we plot the evolution using the corrected secular approximation with black lines. This now perfectly agrees with the numerical solution, which shows that the term in 2g1 − g2 is essential to correctly describe the secular evolution of the system. The eccentricity variations are limited and well described by the secular approximation (Eq. (2)). The eccentricity of planets HIP 65407b and HIP 65407c is within the range 0.129 <eb< 0.204 and 0.027 <ec< 0.103, respectively. These variations are driven mostly by the secular frequency g1 − g2, of a period of approximately 242 years (Table 5).
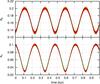 |
Fig. 12 Evolution with time of the eccentricities eb and ec of the two planets HIP 65407b and HIP 65407c, starting with the orbital solution from Table 4. The red lines give the complete solutions for the eccentricities obtained numerically, while the green and black curves are the associated values obtained with the linear secular models (Eqs. (1) and (2), respectively). |
The difference increases with time between the present model taking into account mutual gravitational interactions between planets on one hand and the Keplerian model on the other, which does not (Sect. 5.1.2). Extrapolated to 2050, both models should show differences on the order of ± 10 m/s. A detection of this difference would therefore be feasible in next decades.
5.1.4. Stability analysis
To analyze the stability of the Keplerian solution (Table 4), we performed a global frequency analysis (Laskar 1993) in the vicinity of this solution, in the same way as achieved for other planetary systems (see, e.g., Correia et al. 2005, 2009, 2010).
For each planet the system was integrated on a regular 2D mesh of initial conditions, with varying semi-major axis and eccentricity, while the other parameters were retained at their Keplerian values (Table 4). The solution was integrated over 1000 years for each initial condition. There were typically 400 steps for the semi-major axis and 100 for the eccentricity. All the stability analyses below have similar numbers of steps in their meshes. The stability criterion was derived with the frequency analysis of the mean longitude over the two consecutive 500-year intervals of time (Laskar 1990, 1993). As in Correia et al. (2005, 2009, 2010), the chaotic diffusion was measured by the variation of the mean motion in each time interval, ni and  , given by the index
 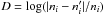 , where i corresponds to the orbit whose initial conditions are not fixed. For regular quasi-periodic motions, there are no variations in the mean motion along the trajectory, whereas a variation of the mean motion is the signature of chaotic behavior. The result is reported using a color index in Fig. 13, where the red area represents the strongly chaotic trajectories (D> −2 in the present case), and the dark-blue area the extremely stable ones (D< −4).
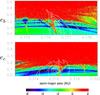 |
Fig. 13 Stability analysis of the Keplerian fit of the HIP 65407 planetary system. For fixed initial conditions (Table 4), the phase space of the system is explored by varying the semi-major axis ap and eccentricity ep of each planet, HIP 65407b and HIP 65407c, respectively. The red zone corresponds to highly unstable orbits, while the dark-blue region can be assumed to be stable on timescales of a billion years (the color scale shows the D values; see Sect. 5.1.4). The contour curves indicate the 1, 2, 3, 5, 10σ confidence intervals from Δχ2. |
In Fig. 13 we show the wide vicinity of the best-fit solution, the minima of the χ2 level curves corresponding to the Keplerian parameters (Table 4). We observe the presence of the strong 12:5 mean motion resonance, which is particularly unstable. We clearly see that the present system is outside this resonance, in a more stable area at the bottom right side (Fig. 13, top) or at the bottom left side (Fig. 13, bottom).
From the previous stability analysis, it is clear that the HIP 65407 planetary system listed in Table 4 is stable over a Gyr timescale. Nevertheless, we also tested this directly by performing a numerical integration of the orbits over 1 Gyr. We used the symplectic integrator SABAC4 of Laskar & Robutel (2001) with a step size of 0.01 yr, including general relativity corrections. The orbits evolved in a regular way and remained stable throughout the simulation.
5.1.5. Additional constraints from dynamic
We assumed that the dynamics of the two planets is not disturbed much by the presence of an additional low-mass close-by planet. We can therefore test the possibility of an additional third planet in the system by varying its semi-major axis, eccentricity, and longitude of the periastron over a wide range, and performing a stability analysis as in Fig. 13. The test was completed for a fixed value K = 0.1 m/s, corresponding to a possible Earth-mass planet HIP 65407d at approximately 1 AU, whose radial velocity amplitude is at the edge of detection. From the analysis of the stable areas in Fig. 14, we see that additional planets are only possible beyond 0.7 AU, which corresponds to orbital periods longer than 0.6 yr (the orbital period of Venus).
 |
Fig. 14 Possible location of an additional third planet in the HIP 65407 system. The stability of an Earth-mass planet is analyzed for various semi-major axes versus eccentricity (top), or mean anomaly (bottom). All the angles of the putative planet are set to 0° (except for the mean anomaly in the bottom panel), and in the bottom panel its eccentricity is 0. As in Fig. 13, the color scale corresponds to D values between −6 and 2. The only stable zones where additional planets can be found are the dark blue regions. |
We can also try to find constraints on the highest masses of the current two-planet system if we assume co-planarity of the orbits. Up to now, we assumed that the inclination of the system to the line of sight is 90°, which gives minimum values for the planetary masses (Table 4). By decreasing the inclination of the orbital plane of the system, we increased the values of the mass of all planets and repeated a stability analysis of the orbits, like in Fig. 13. With decreasing inclination, the stable dark blue areas become narrower, to a point that the minimum χ2 of the best-fit solution lies outside the stable zones. At this point, we conclude that the system cannot be stable anymore. It is not straightforward to find a transition inclination between the two regimes, but we can infer from our plots that stability of the whole system is still possible for an inclination as low as 10°, but becomes impossible for an inclination around 7°. Therefore, we conclude that the highest masses of the planets may be most probably computed for an inclination around 10°, corresponding to a scaling factor of about 6 to 8 for the possible masses. This corresponds to highest masses of 3.4 MJup and 6.2 MJup for HIP 109600b and HIP 109600c, respectively.
5.2. HD 141399
5.2.1. Keplerian fits
We started observing the low-activity star HD 141399 (BD + 47°2267, HIP 77301) with SOPHIE in March 2008. Two inner planets HD 141399b and HD 141399c appeared near resonance 2:1 at periods around 94 and 202 days. We continued the follow-up of this interesting system with SOPHIE+ starting in July 2011. The improved accuracy of SOPHIE+ allowed the third planet HD 141399d to be detected at a period near 1070 days. We were following-up HD 141399 to characterize the additional drift due to a possible fourth external planet when Voigt et al. (2014) announced their independent detection of a four-planet system around this star based on HIRES and APF data.
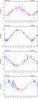 |
Fig. 15 Phase-folded radial velocity curves for each of the four planets around HD 141399 (planets b, c, d, and e from top to bottom) after removing the effect of the three other planets. The SOPHIE data obtained before and after the June-2011 upgrade are plotted in blue and red with 1σ error bars, and the Keplerian fits are the solid lines. Orbital parameters corresponding to the fits are reported in Table 4. |
Voigt et al. (2014) provided a stellar mass and activity index in agreement with what we obtained. We derived a slightly hotter Teff and a more accurate metallicity, however. The SOPHIE radial velocities and their four-planet Keplerian model are plotted in Fig. 2 as a function of time. The four phase-folded curves are presented in Fig. 15. The 139 SOPHIE and SOPHIE+ measurements cover seven years and have a relative shift of 25.9 ± 5.8 m/s. Their dispersions around the four-planet Keplerian fit are 12.8 and 4.8 m/s, respectively. By comparison, the 77 HIRES measurements from Voigt et al. (2014) cover ten years with a better dispersion around the Keplerian fit of 2.3 m/s, whereas their 14 APF measurements cover half a year with a similar accuracy (2.6 m/s). The four-planet Keplerian fit of our data present a solution similar to the one presented by Voigt et al. (2014). Our periodograms are similar to those they present in their Fig. 4. The peaks in the SOPHIE data are slightly stronger and narrower because of our higher number of measurements, allowing an improved phase sampling.
The parameters we present in Table 4 are those obtained from the four-planet Keplerian fit of the whole available dataset, that is, including our new data and those of Voigt et al. (2014). The parameters are similar to those reported by Voigt et al. (2014), with some improvements in the uncertainties thanks to the additional data. We confirm the four-planet system around HD 141399 as presented by Voigt et al. (2014). We note that with its period of 202 days, the insolation level received by HD 141399b is 1.3 ± 0.3 that received by Earth; the giant planet HD 141399b is thus located in the habitable zone of its host star. The transit probabilities for HD 141399b and HD 141399c are around 1%, but we did not attempt any transit detection up to now. The transit probability of the two outer planets is one order of magnitude smaller.
No astrometric motions corresponding to the four planets were detected in the Hipparcos data (Sect. 4), in agreement with the non-detection of any secondary peak in the CCFs. The derived upper limits Mp max on the masses of the inner planets b and c are 0.22 and 0.12M⊙, respectively. No upper limit could be derived for the outer planet e, the time span of the Hipparcos data covering only a small portion of the orbit. For HD 141399d, the Hipparcos data cover slightly more than an orbital period (about three years) and the derived upper limit is 0.04M⊙; we therefore conclude that this companion is clearly substellar, with a true mass below 40 MJup.
The main problem is characterizing the outer planet, HD 141399e, which is a Jupiter near-twin. Its eccentricity and orbital period remain poorly constrained. Even if a complete revolution could have been covered thanks to our new data, similar radial-velocity amplitudes can be produced by simultaneously increasing the eccentricity and the orbital period (as 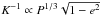 ). Voigt et al. (2014) announced a period of 3717 ± 555 days, whereas our new data alone provide
  days. Fitting the whole dataset provides the conservative estimate of
  days. We obtained an eccentricity of 0.26 ± 0.22 by the simultaneous fit of the whole dataset, so we cannot significantly conclude from the Keplerian fits whether the orbit is circular or not. Voigt et al. (2014) assumed a circular orbit for HD 141399e due to the lack of constraint, acknowledging that there are no reasons for this long-period orbit to be perfectly circular.
Following these Keplerian approaches, we studied the gravitational interactions between planets, in particular to try to set constraints on the period and eccentricity of the outer planet HD 141399e.
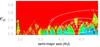 |
Fig. 16 Stability analysis of the outermost planet HD 141399e for the Keplerian fit (Table 4). For fixed initial conditions, the phase space of the system is explored by varying the semi-major axis ae and the eccentricity ee. As in Fig. 13, the color scale shows D values between −6 and 2. The red zone corresponds to highly unstable orbits, while the dark blue region can be assumed to be stable on a billion-years timescale. The contour curves indicate the 2, 3, 5, 10σ confidence intervals from Δχ2. The best fit lies well inside a red chaotic region. |
5.2.2. Stability analysis
The solution corresponding to the Keplerian fit (Table 4) allows high values for the eccentricity of the outer planet HD 141399e (ee = 0.26 ± 0.22). We tested the reliability of this solution by performing a global stability study in its vicinity as explained above for the HIP 65407 system (Sect. 5.1.4). Figure 16 shows the wide vicinity of the best-fit solution. For fixed initial conditions, the phase space of the system was explored here again by varying the semi-major axis ae and eccentricity ee. For each initial condition, the system was integrated over 1000 years and the stability criterion was derived with the frequency analysis of the mean longitude. We observe that the minima of the χ2 level curves corresponding to the Keplerian parameters (Table 4) lies deep inside an extremely chaotic region, therefore we conclude that the Keplerian solution is highly unstable.
 |
Fig. 17 Stability analysis of the dynamically stable orbital solution for the HD 141399 planetary system (planets HD 141399b, c, d, and e from top to bottom). As in Fig. 13, the color scale shows D values between −6 and 2. The red zone corresponds to highly unstable orbits, while the dark blue region can be assumed to be stable on a billion-years timescale. The contour curves indicate the 1, 2, 3, 5, 10σ confidence intervals from Δχ2. The minima always lie in a stable region for all four planets in the system. |
In Fig. 16 we also observe that any solution with an eccentricity above 0.1 is unstable. Therefore, stable solutions for the HD 141399 system require a low eccentricity value for the outermost planet. For simplicity, we proceeded as in Vogt et al. (2014) and fixed the eccentricity at zero (ee = 0). We refit the observational data holding this parameter constant, which provides a new orbital configuration for the system. The orbits of the three inner planets are almost unchanged with respect to the Keplerian solution, but the orbital period of the outermost planet is now better constrained. To check the robustness of this new solution, we then repeated a stability study in the vicinity of the outermost planet. Again, the minima of the χ2 level curves lie inside a chaotic region, namely, the resonant island corresponding to a 3:1 mean motion resonance between planets HD 141399d and HD 141399e.
In contrast to other planetary systems (see, e.g., Laskar & Correia 2009), the 3:1 mean motion resonance is unstable in this case. However, just outside this resonance, the system appears to be stable. It is then likely that the period ratio between the two outermost planets is slightly shorter or longer than the 3:1 ratio, longer periods being even more stable.
We tested this new scenario by additionally fixing the orbital period of the outer planet slightly above the resonant ratio (we chose Pe = 3412 days here). We fit the radial velocities holding this parameter constant (together with ee = 0), which provides a new orbital configuration for the system. The parameters are all similar to the Keplerian ones presented in Table 4, except for the period and eccentricity of HD 141399e. Both solutions provide similar fits in terms of dispersion of their residuals, but the new solution is stable, whereas the Keplerian one is not. We performed a global stability study in the vicinity of this new solution, which is shown in Fig. 17. We verified that the minima of the χ2 level curves lie inside stable regions for all four planets in the system. At ee = 0, the intersection between χ2 level curves and stabilities zones provides the two intervals corresponding to ae = 4.33 ± 0.02 and ae = 4.50 ± 0.08 for HD 141399e, below and above the 3:1 resonance, respectively. We finally adopted the solution above the resonance, which is the most stable; it corresponds to an orbital period of Pe = 3370 ± 90 days.
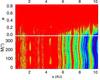 |
Fig. 18 Possible location of an additional fifth planet in the HD 141399 system. The stability of an Earth-mass planet is analyzed for various semi-major axes versus eccentricity (top) or mean anomaly (bottom). All the angles of the putative planet are set to 0° (except for the mean anomaly in the bottom panel), and in the bottom panel its eccentricity is 0. As in Fig. 13, the color scale corresponds to D values between −6 and 2. The stable zones where additional planets can be found are the dark blue regions. |
5.2.3. Additional constraints from dynamic
Similarly to the HIP 65407 system (Sect. 5.1.5), we assumed that the dynamics of the already known planets is not disturbed much by the presence of an additional fifth low-mass still undetected planet. This test was again completed for a fixed value K = 0.1 m/s, corresponding to a possible Earth-mass object at approximately 1 AU, whose radial velocity amplitude is at the edge of detection. From the analysis of the stable areas in Fig. 18, we see that additional planets are possible beyond 6 AU, which corresponds to orbital periods longer than 14 years. We also spot some small stability islands at the same semi-major axes of planets HD 141399d and HD 141399e; they correspond to the Lagrange co-orbital resonance of the two planets, that is, Trojan planets.
We also tried to find constraints on the maximal masses of the current system if we assumed co-planarity of the orbits, as we did above for BD+492211 (Sect. 5.1.5). We conclude that the highest masses of the planets may be most probably computed for an inclination around 10°, corresponding to 4, 11, 9, and 5 MJup for planet HD 141399b, c, d, and e, respectively.
6. Conclusions
We have presented new radial velocity measurements of eight stars secured with the spectrograph SOPHIE at the 193 cm telescope of the Haute-Provence Observatory, allowing the detection and characterization of new giant extrasolar planets. Seven of the stars allowed us to discover and characterize six new single planets as well as a system including two planets. The eighth star was already known to host a multi-planetary system, and we published here our independent measurements and discovery. The 12 giant planets studied here are compared in Fig. 19 with the other known giant exoplanets. We measured their masses with an accuracy of about ± 5%. They allow the diversity of extrasolar planets populations to be explored, setting constraints on models of planetary system formation and evolution.
We summarize some of their notable properties below:
-
HD 143105 is one of the brightest stars known to host a hot Jupiter, which could allow numerous follow-up studies to be conducted, even though this is not a transiting system;
-
HIP 109600b, HD 35759b, HIP 109384b, HD 12484b are new giant single planets with orbital periods of several months, with no hints of additional companions in the systems;
-
the data of the new single-planet systems allow us to exclude the possibility that they are composed of two circular planets in 2:1 resonance;
-
HD 220842 hosts a massive giant planet, and another substellar companion needing a long-term follow-up to be characterized;
-
the hot Jupiter HD 143105b and the warm Jupiter HD 12484b are among the few planets detected around moderately fast rotating stars, HD 12484 being in addition a particularly active star;
-
the two multi-planetary systems around HIP 65407 and HD 141399 have host stars with particularly high metallicities;
-
HIP 109600, HIP 109384, and HD 220842 are metal-poor stars, which is unusual for hosts of giant planets;
-
the system around HIP 65407 includes two planets just outside the instable 12:5 resonance, both precessing with a period of 206 years;
-
in order to be stable, the nearly Jupiter-twin HD 141399e should have an eccentricity below 0.1 and an orbital period P = 3370 ± 90 days;
-
the giant planets HIP 109600b, HIP 109384b, and HD 141399c are located in the habitable zone of their host star, making any potential satellite orbiting these planets particularly interesting, even if such moons remain for now beyond the reach of standard detection technics.
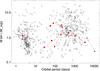 |
Fig. 19 Sky-project masses and orbital periods of known giant planets (diamonds, from exoplanets.org). The 12 planets from the present study are plotted as red squares. The planets from the multiple systems HIP 65407 and HD 141399 are linked by lines. Jupiter and Saturn are also plotted and linked (blue triangles). With the adopted range in y-axes, the plot only shows giant planets; planets with sky-projected masses below 0.1 MJup = 32 MEarth are not displayed here. |
Acknowledgments
We thank all the staff of Haute-Provence Observatory for their support at the 1.93 m telescope and on SOPHIE. This work is also based in part on data collected at Subaru Telescope, which is operated by the National Astronomical Observatory of Japan, and on observations taken with the Remote Observatory Theoretical Astrophysics Tuebingen (ROTAT) located at OHP (France). ROTAT is operated by the Foundation Interactive Astronomy and Astrophysics (Stiftung Interaktive Astronomie und Astrophysik; www.stiftung-astronomie.de). This work was granted access to the HPC resources of MesoPSL financed by the Region Île-de-France and the project Equip@Meso (reference ANR-10-EQPX-29-01) of the programme “Investissements d’Avenir” supervised by the Agence Nationale pour la Recherche. This work was also supported by the “Programme National de Planétologie” (PNP) of CNRS/INSU, the Swiss National Science Foundation, the French National Research Agency (ANR-12-BS05-0012), and the Fundação para a Ciência e a Tecnologia (FCT) through the research grants UID/FIS/04434/2013 and PTDC/FIS-AST/1526/2014. N.C.S. acknowledges support from FCT through Investigador FCT contracts of reference IF/00169/2012, and POPH/FSE (EC) by FEDER funding through the program “Programa Operacional de Factores de Competitividade – COMPETE”. A.S. is supported by the European Union under a Marie Curie Intra-European Fellowship for Career Development with reference FP7-PEOPLE-2013-IEF, number 627202. J.H. is supported by the Swiss National Science Foundation (SNSF). A.C.M.C. and J.L. acknowledge support from the “conseil scientifique” of the Observatory of Paris and CIDMA strategic project UID/MAT/04106/2013. P.A.W acknowledges the support of the French Agence Nationale de la Recherche (ANR), under program ANR-12-BS05-0012 “Exo-Atmos”.
References
- Allard, F. 2014, IAU Symp., 299, 271 [NASA ADS] [Google Scholar]
- Anderson, D. R., CollierCameron, A., Delrez, L., et al. 2014, MNRAS, 445, 1114 [NASA ADS] [CrossRef] [Google Scholar]
- Anglada-Escudé, G., López-Morales, M., & Chambers, J. E. 2010, ApJ, 709, 168 [NASA ADS] [CrossRef] [Google Scholar]
- Baraffe, I., Chabrier, G., Fortney, J., & Sotin, C. 2014, Protostars and Planets VI, 763 [Google Scholar]
- Baranne, A., Queloz, D., Mayor, M., et al. 1994, A&AS, 119, 373 [Google Scholar]
- Boisse, I., Moutou, C., Vidal-Madjar, A., et al. 2009, A&A, 495, 959 [NASA ADS] [CrossRef] [EDP Sciences] [Google Scholar]
- Boisse, I., Eggenberger, A., Santos, N. C., et al. 2010, A&A, 523, A88 [NASA ADS] [CrossRef] [EDP Sciences] [Google Scholar]
- Bonomo, A. S., Santerne, A., Alonso, R., et al. 2010, A&A, 520, A65 [NASA ADS] [CrossRef] [EDP Sciences] [Google Scholar]
- Boss, A. P. 2011, ApJ, 731, 74 [NASA ADS] [CrossRef] [Google Scholar]
- Bouchy, F., Pont, F., Melo, C., et al. 2005a, A&A, 431, 1105 [NASA ADS] [CrossRef] [EDP Sciences] [Google Scholar]
- Bouchy, F., Udry, S., Mayor, M., et al. 2005b, A&A, 444, L15 [NASA ADS] [CrossRef] [EDP Sciences] [Google Scholar]
- Bouchy, F., Hébrard, G., Udry, S., et al. 2009, A&A, 505, 853 [NASA ADS] [CrossRef] [EDP Sciences] [Google Scholar]
- Bouchy, F., Díaz, R. F., Hébrard, G., et al. 2013, A&A, 549, A49 [NASA ADS] [CrossRef] [EDP Sciences] [Google Scholar]
- Bouchy, F., Ségransa, D., Díaz, R. F., et al. 2016, A&A, 585, A46 [NASA ADS] [CrossRef] [EDP Sciences] [Google Scholar]
- Brogi, M., Snellen, I. A. G., de Kok, R. J., et al. 2012, Nature, 486, 502 [NASA ADS] [CrossRef] [PubMed] [Google Scholar]
- Butler, R. P., Marcy, G. W., Williams, E., et al. 1997, ApJ, 474, L115 [NASA ADS] [CrossRef] [Google Scholar]
- Cai, K., Pickett, M. K., Durisen, R. H., & Milne, A. M. 2010, ApJ, 716, L176 [NASA ADS] [CrossRef] [Google Scholar]
- Carolo, E., Desidera, S., Gratton, R., et al. 2014, A&A, 567, A48 [NASA ADS] [CrossRef] [EDP Sciences] [Google Scholar]
- Charbonneau, D., Noyes, R. W., Korzennik, S. G., et al. 1999, ApJ, 522, L145 [NASA ADS] [CrossRef] [Google Scholar]
- Charbonneau, D., Brown, T. M., Latham, D. W., & Mayor, M. 2000, ApJ, 529, L45 [NASA ADS] [CrossRef] [PubMed] [Google Scholar]
- Carter-Bond, J. C., O’Brien, D. P., & Raymond, S. N. 2012, ApJ, 760, 44 [NASA ADS] [CrossRef] [Google Scholar]
- Chauvin, G., Vigan, A., Bonnefoy, M., et al. 2015, A&A, 573, A127 [NASA ADS] [CrossRef] [EDP Sciences] [Google Scholar]
- Chib, S., & Jeliazkov, I. 2011, J. Am. Statist. Assoc., 453, 270 [Google Scholar]
- Correia, A. C. M., Udry, S., Mayor, M., et al. 2005, A&A, 440, 751 [NASA ADS] [CrossRef] [EDP Sciences] [Google Scholar]
- Correia, A. C. M., Udry, S., Mayor, M., et al. 2009, A&A, 496, 521 [NASA ADS] [CrossRef] [EDP Sciences] [Google Scholar]
- Correia, A. C. M., Couetdic, J., Laskar, J., et al. 2010, A&A, 511, A21 [NASA ADS] [CrossRef] [EDP Sciences] [Google Scholar]
- Courcol, B., Bouchy, F., Pepe, F., et al. 2015, A&A, 581, A38 [NASA ADS] [CrossRef] [EDP Sciences] [Google Scholar]
- DaSilva, R., Udry, S., Bouchy, F., et al. 2008, A&A, 473, 323 [Google Scholar]
- Delisle, J.-B., & Laskar, J. 2014, A&A, 570, L7 [NASA ADS] [CrossRef] [EDP Sciences] [Google Scholar]
- Díaz, R. F., Santerne, A., Sahlmann, J., et al. 2012, A&A, 538, A113 [NASA ADS] [CrossRef] [EDP Sciences] [Google Scholar]
- Díaz, R. F., Rey, J., Demangeon, O., et al. 2016a, A&A, submitted [Google Scholar]
- Díaz, R. F., Ségransan, D., Udry, S., et al. 2016b, A&A, 585, A134 [NASA ADS] [CrossRef] [EDP Sciences] [Google Scholar]
- Ehrenreich, D., Bourrier, V., Bonfils, X., et al. 2012, A&A, 547, A18 [NASA ADS] [CrossRef] [EDP Sciences] [Google Scholar]
- Fares, R., Donati, J., Moutou, C., et al. 2009, MNRAS, 398, 1383 [NASA ADS] [CrossRef] [MathSciNet] [Google Scholar]
- Gaulme, P., Vannier, M., Guillot, T., et al. 2010, A&A, 518, L153 [NASA ADS] [CrossRef] [EDP Sciences] [Google Scholar]
- Guilera, O. M., Brunini, A., & Benvenuto, O. G. 2010, A&A, 521, A50 [NASA ADS] [CrossRef] [EDP Sciences] [Google Scholar]
- Hagelberg, J., Ségransan, D., Udry, S., & Wildi, F. 2016, MNRAS, 455, 2178 [NASA ADS] [CrossRef] [Google Scholar]
- Han, E., Wang, S. X., Wright, J. T., et al. 2014, PASP, 126, 827 [NASA ADS] [CrossRef] [Google Scholar]
- Hébrard, G., Bonfils, X., Ségransan, D., et al. 2009, A&A, 513, A69 [Google Scholar]
- Hébrard, G., Ehrenreich, D., Bouchy, F., et al. 2011, A&A, 527, L11 [NASA ADS] [CrossRef] [EDP Sciences] [Google Scholar]
- Hébrard, G., Collier Cameron, A., Brown, D. J. A., et al. 2013, A&A, 549, A134 [NASA ADS] [CrossRef] [EDP Sciences] [Google Scholar]
- Heng, K., & Demory, B.-O. 2013, ApJ, 777, 100 [NASA ADS] [CrossRef] [Google Scholar]
- Jovanovic, N., Martinache, F., Guyon, O., et al. 2015, PASP, 127, 890 [NASA ADS] [CrossRef] [Google Scholar]
- Jenkins, J. M., Twicken, J. D., Batalha, N. M., et al. 2015, AJ, 150, 56 [NASA ADS] [CrossRef] [Google Scholar]
- Kopparapu, R. K., Ramirez, R., Kasting, J. F., et al. 2013, ApJ, 765, 131 [NASA ADS] [CrossRef] [Google Scholar]
- Kürster, M., Trifonov, T., Reffert, S., et al. 2015, A&A, 577, A103 [NASA ADS] [CrossRef] [EDP Sciences] [Google Scholar]
- Laskar, J. 1990, Icarus, 88, 266 [NASA ADS] [CrossRef] [Google Scholar]
- Laskar, J. 1993, Phys. D Nonlin. Phenomena, 67, 257 [Google Scholar]
- Laskar, J., & Correia, A. C. M. 2009, A&A, 496, L5 [NASA ADS] [CrossRef] [EDP Sciences] [Google Scholar]
- Laskar, J., & Robutel, P. 2001, Celest. Mech. Dyn. Astron., 80, 39 [NASA ADS] [CrossRef] [Google Scholar]
- Leigh, C., Collier Cameron, A., Udry, S., et al. 2003, MNRAS, 346, L16 [NASA ADS] [CrossRef] [Google Scholar]
- Levison, H. F., Morbidelli, A., Gomes, R., et al. 2006, Protostars and PlanetsVI, 669 [Google Scholar]
- Lin, D. N. C., Bodenheimer, P., & Richardson, D. C. 1996, Nature, 380, 606 [NASA ADS] [CrossRef] [Google Scholar]
- Lissauer, J. J., Ragozzine, D., Fabrycky, D. C., et al. 2011, ApJS, 197, 8 [NASA ADS] [CrossRef] [Google Scholar]
- Liu, S.-F., Agnor, C. B., Lin, D. N. C., & Li, S.-L. 2015, MNRAS, 446, 1685 [NASA ADS] [CrossRef] [Google Scholar]
- Lovis, C., Dumusque, X., Santos, N. C., et al. 2011, A&A, submitted [arXiv:1107.5325] [Google Scholar]
- Madhusudhan, N., & Burrows, A. 2012, ApJ, 747, 25 [NASA ADS] [CrossRef] [Google Scholar]
- Mamajek, E. E., & Hillenbrand, L. A. 2008, ApJ, 687, 1264 [NASA ADS] [CrossRef] [Google Scholar]
- Martins, J. H. C., Figueira, P., Santos, N. C., & Lovis, C. 2013, MNRAS, 436, 1215 [NASA ADS] [CrossRef] [Google Scholar]
- Martins, J. H. C., Santos, N. C., Figueira, P., et al. 2015, A&A, 576, A134 [NASA ADS] [CrossRef] [EDP Sciences] [Google Scholar]
- Mayor, M., & Queloz, D. 1995, Nature, 378, 355 [NASA ADS] [CrossRef] [Google Scholar]
- Mayor, M., Marmier, M., Lovis, C., et al. 2011, A&A, submitted [arXiv:1109.2497] [Google Scholar]
- Mordasini, C., Alibert, Y., & Benz, W. 2009, A&A, 501, 1139 [NASA ADS] [CrossRef] [EDP Sciences] [Google Scholar]
- Moutou, C., Mayor, M., Lo Curto, G., et al. 2011, A&A, 527, A63 [NASA ADS] [CrossRef] [EDP Sciences] [Google Scholar]
- Moutou, C., Hébrard, G., Bouchy, F., et al. 2014, A&A, 563, A22 [NASA ADS] [CrossRef] [EDP Sciences] [Google Scholar]
- Naef, D., Mayor, M., Pepe, F., et al. 2001, A&A, 375, 205 [NASA ADS] [CrossRef] [EDP Sciences] [Google Scholar]
- Noyes, R. W., Hartmann, L. W., Baliunas, S. L., et al. 1984, ApJ, 279, 763 [NASA ADS] [CrossRef] [Google Scholar]
- Pepe, F., Mayor, M., Galland, F., et al. 2002, A&A, 388, 632 [NASA ADS] [CrossRef] [EDP Sciences] [Google Scholar]
- Perrakis, K., Ntzoufras, I., & Tsionas, E. G. 2014, Computational Statistics & Data Analysis, 77, 54 [Google Scholar]
- Perruchot, S., Kohler, D., Bouchy, F., et al. 2008, Proc. SPIE, 7014, 70140J [CrossRef] [Google Scholar]
- Perryman, M. A. C., Lindegren, L., Kovalevsky, J., et al. 1997, A&A, 323, L49 [NASA ADS] [Google Scholar]
- Queloz, D., Henry, G. W., Sivan, J. P., et al. 2001, A&A, 379, 279 [NASA ADS] [CrossRef] [EDP Sciences] [Google Scholar]
- Sahlmann, J., & Fekel, F. C. 2013, A&A, 556, A145 [NASA ADS] [CrossRef] [EDP Sciences] [Google Scholar]
- Sahlmann, J., Ségransan, D., Queloz, D., et al. 2011, A&A, 525, A95 [NASA ADS] [CrossRef] [EDP Sciences] [Google Scholar]
- Santos, N. C., Mayor, M., Naef, D., et al. 2000a, A&A, 356, 599 [NASA ADS] [Google Scholar]
- Santos, N. C., Mayor, M., Naef, D., et al. 2000b, A&A, 361, 265 [NASA ADS] [Google Scholar]
- Santos, N. C., Israelian, G., & Mayor, M. 2004, A&A, 415, 1153 [NASA ADS] [CrossRef] [EDP Sciences] [Google Scholar]
- Santos, N. C., Israelian, G., Mayor, M., et al. 2005, A&A, 437, 1127 [NASA ADS] [CrossRef] [EDP Sciences] [Google Scholar]
- Santos, N. C., Udry, S., Bouchy, F., et al. 2008, A&A, 487, 369 [NASA ADS] [CrossRef] [EDP Sciences] [Google Scholar]
- Santos, N. C., Sousa, S. G., Mortier, A., et al. 2013, A&A, 556, A150 [NASA ADS] [CrossRef] [EDP Sciences] [Google Scholar]
- Sato, B., Fischer, D. A., Henry, G. W., et al. 2005, ApJ, 633, 465 [NASA ADS] [CrossRef] [Google Scholar]
- Seager, S., Whitney, B. A., & Sasselov, D. D. 2000, ApJ, 540, 504 [NASA ADS] [CrossRef] [Google Scholar]
- Ségransan, D., Mayor, M., Udry, S., et al. 2011, A&A, 535, A54 [NASA ADS] [CrossRef] [EDP Sciences] [Google Scholar]
- Showman, A. P., & Guillot, T. 2002, A&A, 385, 166 [NASA ADS] [CrossRef] [EDP Sciences] [Google Scholar]
- Sing, D. K., Fortney, J. J., Nikolov, N., et al. 2016, Nature, 529, 59 [NASA ADS] [CrossRef] [Google Scholar]
- Snellen, I. A. G., Brandl, B. R., de Kok, R. J., et al. 2014, Nature, 509, 63 [NASA ADS] [CrossRef] [Google Scholar]
- Sousa, S. G., Santos, N. C., Mayor, M., et al. 2008, A&A, 487, 373 [NASA ADS] [CrossRef] [EDP Sciences] [MathSciNet] [Google Scholar]
- Sozzetti, A., Udry, S., Zucker, S., et al. 2006, A&A, 449, 417 [NASA ADS] [CrossRef] [EDP Sciences] [Google Scholar]
- Torres, G., Andersen, J., & Giménez, A. 2010, A&ARv, 18, 67 [Google Scholar]
- Vogt, S. S., Butler, R. P., Marcy, G. W., et al. 2005, ApJ, 632, 638 [NASA ADS] [CrossRef] [Google Scholar]
- Vogt, S. S., Butler, R. P., Rivera, E. J., et al. 2014, ApJ, 787, 97 [NASA ADS] [CrossRef] [Google Scholar]
- Wilson, P. A., Hébrard, G., Santos, N. C., et al. 2016, A&A, 588, A144 [NASA ADS] [CrossRef] [EDP Sciences] [Google Scholar]
- Wittenmyer, R. A., Wang, S., Horner, J., et al. 2013, ApJS, 208, 2 [NASA ADS] [CrossRef] [Google Scholar]
- Wright, J. T., Marcy, G. W., Butler, R. P., et al. 2008, ApJ, 683, L63 [NASA ADS] [CrossRef] [Google Scholar]
All Tables
Radial velocities (barycentric referential) and bisector span measured with SOPHIE.
Fitted Keplerian orbits and planetary parameters for the six single-planet systems, with 1σ error bars.
Fitted Keplerian orbits and planetary parameters for the two multi-planetary systems, with 1σ error bars.
All Figures
|
Fig. 1 Histogram of the radial velocity dispersions for 1900 stars observed with SOPHIE since 2006 as part of the giant planet survey (dashed black line). The typical accuracy is about ± 7 m/s. The histogram plotted as a solid red line selects only the measurements secured after SOPHIE was improved in June 2011; it shows an improvement of the radial velocity accuracy on a level of ± 3.5 m/s. To allow a better comparison between the two histograms, the y-scale of the red histogram has been multiplied by a factor four. |
| In the text | |
|
Fig. 2 Radial velocity SOPHIE measurements of the eight stars as a function of time (values before and after the June-2011 upgrade are plotted in blue and red), and Keplerian fits. The orbital parameters corresponding to the Keplerian fits are reported in Tables 3 and 4. In each panel, the residuals with 1σ error bars are plotted below the fit. |
| In the text | |
|
Fig. 3 H and K Ca ii lines of the eight planet-host stars on the averaged SOPHIE spectra. The stars are sorted by increasing activity from bottom to top, with the |
| In the text | |
|
Fig. 4 Phase-folded radial velocity curves for the six stars with a single-planet detection. The SOPHIE data obtained before and after the June-2011 upgrade are plotted in blue and red with 1σ error bars, and the Keplerian fits are the solid lines. The orbital parameters corresponding to the Keplerian fits are reported in Table 3. For HD 220842 the linear drift is subtracted here. The HD 143105b transit detection attempt of 2013-09-17 is shown around φ = 0.25. |
| In the text | |
|
Fig. 5 Search for transits of HD 143105b. Top: photometry. The differential photometry is plotted as a function of the phase of the searched transits. The telescopes (CROW or ROTAT) and the dates are indicated for each of the six observations, which have been shifted in y-axes for clarity. The horizontal lines represent the mean of the data (or mean outside the event for 2013-08-26 with ROTAT). The original data (plus signs) have been binned to have a point approximatively every 120 s (diamond signs) to facilitate the comparison. The vertical dashed lines represent the hypothetical ingress, center, and egress phases for central transits. The transit-like event observed on 2013-08-26 with ROTAT was not confirmed by other observations. Bottom: spectroscopy. SOPHIE radial velocities measured during a possible transit (2013-09-17). The expected Rossiter-McLaughlin anomaly is shown as a dotted line (for an aligned, prograde orbit); it is not detected. The solid line shows the Keplerian model with no transit (Figs. 2 and 4, Table 3). |
| In the text | |
|
Fig. 6 Magnitudes of known hot-Jupiter host stars as a function of the planet discovery year. Transiting systems are empty symbols, non-transiting systems detected only in radial velocities are filled. Hot Jupiters are selected from exoplanets.org as planets with masses >0.2 MJup and periods <6 days (220 planets). The host star of the new hot Jupiter HD 143105b is indicated with an arrow. |
| In the text | |
|
Fig. 7 Subaru/SCExAO ADI observation of HD 220842 in H band (upper panel). No candidate has been resolved in this snapshot. The lower panel shows the corresponding upper limits on the companion producing the radial velocity drift of HD 220842. Detection limits at 1 and 5σ are plotted as dashed and solid lines, respectively. The mass estimate is based on BT-SETTL CIFIST2011 models (Allard et al. 2014). The contrast curve has been corrected to take self-subtraction into account. Companions above the solid line would have been detected at more than 5σ. |
| In the text | |
|
Fig. 8 Bisector span as a function of the radial velocity residuals after the Keplerian fit for HD 12484. The clear anticorrelation indicates that the residuals are mainly due to the stellar activity. |
| In the text | |
|
Fig. 9 Lomb-Scargle periodograms of the SOPHIE radial velocities of HIP 65407. Upper panel: periodogram computed from the radial velocities with all fits. The second and third panels show the periodograms computed from the residuals of the fits that only include HIP 65407b or HIP 65407c, respectively. Bottom panel: periodogram after subtracting the two-planet fit. The two vertical dotted lines show the periods of the two planets. The horizontal dashed lines correspond to the false-alarm probability of 1 × 10⁻³. |
| In the text | |
|
Fig. 10 Phase-folded radial velocity curves for HIP 65407b (P = 28.1 d, top) and HIP 65407c (P = 67.3 d, bottom) after removing the effect of the other planet. The SOPHIE data obtained before and after the June-2011 upgrade are plotted in blue and red with 1σ error bars, and the Keplerian fits are the solid lines. Orbital parameters corresponding to the fits are reported in Table 4. |
| In the text | |
|
Fig. 11 Evolution in the HIP 65407 two-planet system of the angle Δω = ωc − ωb (red line), which oscillates around 180° with a maximal amplitude of 45°. The green and black lines (nearly overplotted) also give the Δω evolution, but obtained with the linear secular models (Eqs. (1) and (2), respectively). |
| In the text | |
|
Fig. 12 Evolution with time of the eccentricities eb and ec of the two planets HIP 65407b and HIP 65407c, starting with the orbital solution from Table 4. The red lines give the complete solutions for the eccentricities obtained numerically, while the green and black curves are the associated values obtained with the linear secular models (Eqs. (1) and (2), respectively). |
| In the text | |
|
Fig. 13 Stability analysis of the Keplerian fit of the HIP 65407 planetary system. For fixed initial conditions (Table 4), the phase space of the system is explored by varying the semi-major axis ap and eccentricity ep of each planet, HIP 65407b and HIP 65407c, respectively. The red zone corresponds to highly unstable orbits, while the dark-blue region can be assumed to be stable on timescales of a billion years (the color scale shows the D values; see Sect. 5.1.4). The contour curves indicate the 1, 2, 3, 5, 10σ confidence intervals from Δχ2. |
| In the text | |
|
Fig. 14 Possible location of an additional third planet in the HIP 65407 system. The stability of an Earth-mass planet is analyzed for various semi-major axes versus eccentricity (top), or mean anomaly (bottom). All the angles of the putative planet are set to 0° (except for the mean anomaly in the bottom panel), and in the bottom panel its eccentricity is 0. As in Fig. 13, the color scale corresponds to D values between −6 and 2. The only stable zones where additional planets can be found are the dark blue regions. |
| In the text | |
|
Fig. 15 Phase-folded radial velocity curves for each of the four planets around HD 141399 (planets b, c, d, and e from top to bottom) after removing the effect of the three other planets. The SOPHIE data obtained before and after the June-2011 upgrade are plotted in blue and red with 1σ error bars, and the Keplerian fits are the solid lines. Orbital parameters corresponding to the fits are reported in Table 4. |
| In the text | |
|
Fig. 16 Stability analysis of the outermost planet HD 141399e for the Keplerian fit (Table 4). For fixed initial conditions, the phase space of the system is explored by varying the semi-major axis ae and the eccentricity ee. As in Fig. 13, the color scale shows D values between −6 and 2. The red zone corresponds to highly unstable orbits, while the dark blue region can be assumed to be stable on a billion-years timescale. The contour curves indicate the 2, 3, 5, 10σ confidence intervals from Δχ2. The best fit lies well inside a red chaotic region. |
| In the text | |
|
Fig. 17 Stability analysis of the dynamically stable orbital solution for the HD 141399 planetary system (planets HD 141399b, c, d, and e from top to bottom). As in Fig. 13, the color scale shows D values between −6 and 2. The red zone corresponds to highly unstable orbits, while the dark blue region can be assumed to be stable on a billion-years timescale. The contour curves indicate the 1, 2, 3, 5, 10σ confidence intervals from Δχ2. The minima always lie in a stable region for all four planets in the system. |
| In the text | |
|
Fig. 18 Possible location of an additional fifth planet in the HD 141399 system. The stability of an Earth-mass planet is analyzed for various semi-major axes versus eccentricity (top) or mean anomaly (bottom). All the angles of the putative planet are set to 0° (except for the mean anomaly in the bottom panel), and in the bottom panel its eccentricity is 0. As in Fig. 13, the color scale corresponds to D values between −6 and 2. The stable zones where additional planets can be found are the dark blue regions. |
| In the text | |
|
Fig. 19 Sky-project masses and orbital periods of known giant planets (diamonds, from exoplanets.org). The 12 planets from the present study are plotted as red squares. The planets from the multiple systems HIP 65407 and HD 141399 are linked by lines. Jupiter and Saturn are also plotted and linked (blue triangles). With the adopted range in y-axes, the plot only shows giant planets; planets with sky-projected masses below 0.1 MJup = 32 MEarth are not displayed here. |
| In the text | |
Current usage metrics show cumulative count of Article Views (full-text article views including HTML views, PDF and ePub downloads, according to the available data) and Abstracts Views on Vision4Press platform.
Data correspond to usage on the plateform after 2015. The current usage metrics is available 48-96 hours after online publication and is updated daily on week days.
Initial download of the metrics may take a while.