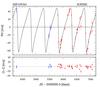
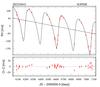
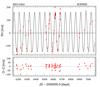
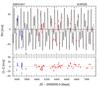
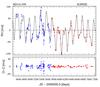
Fig. 2
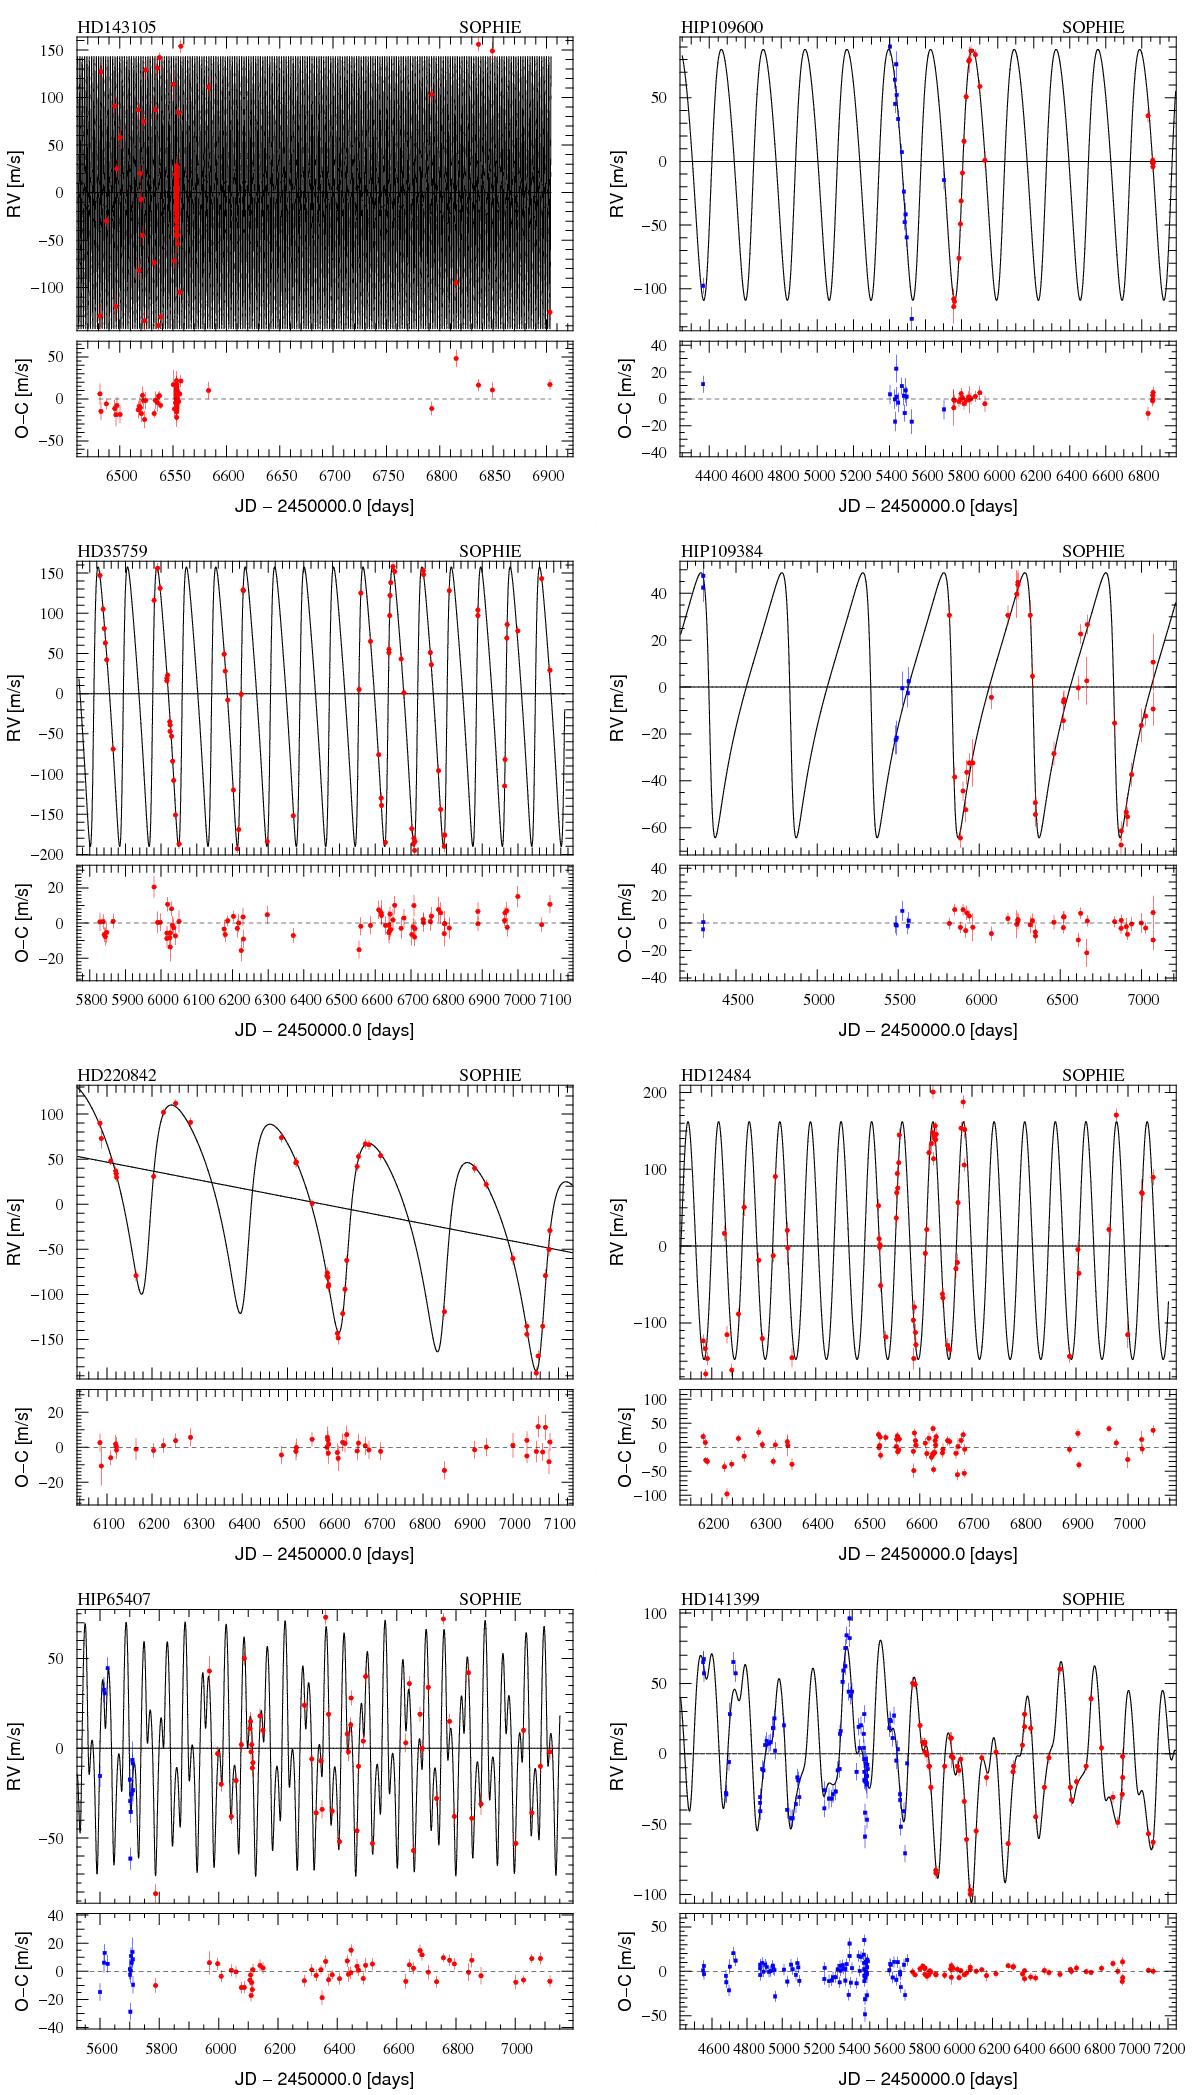
Radial velocity SOPHIE measurements of the eight stars as a function of time (values before and after the June-2011 upgrade are plotted in blue and red), and Keplerian fits. The orbital parameters corresponding to the Keplerian fits are reported in Tables 3 and 4. In each panel, the residuals with 1σ error bars are plotted below the fit.
Current usage metrics show cumulative count of Article Views (full-text article views including HTML views, PDF and ePub downloads, according to the available data) and Abstracts Views on Vision4Press platform.
Data correspond to usage on the plateform after 2015. The current usage metrics is available 48-96 hours after online publication and is updated daily on week days.
Initial download of the metrics may take a while.