Fig. 16
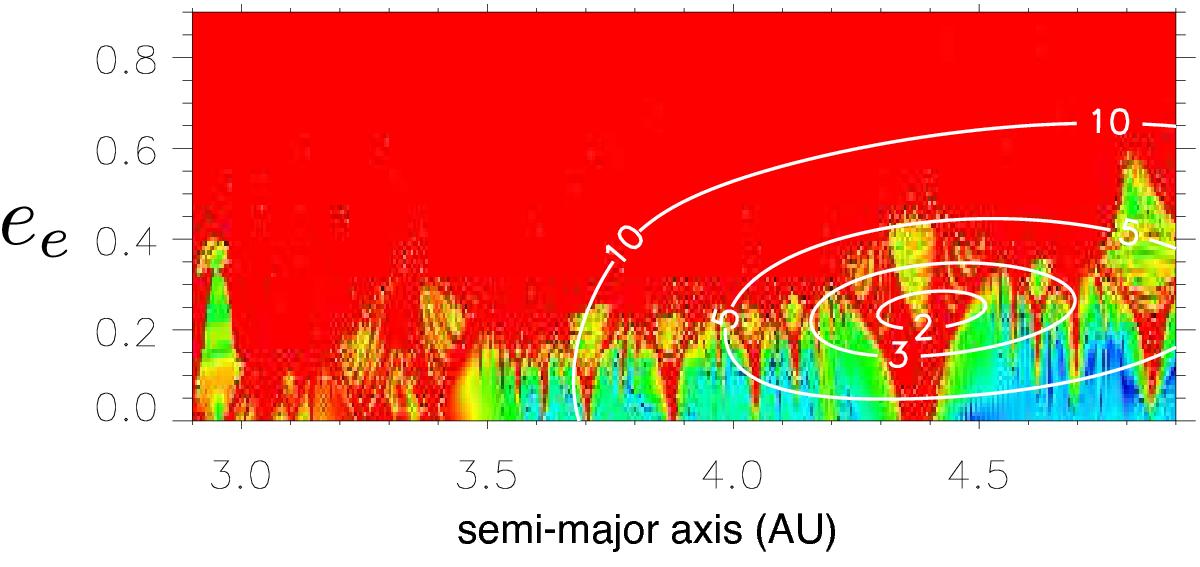
Stability analysis of the outermost planet HD 141399e for the Keplerian fit (Table 4). For fixed initial conditions, the phase space of the system is explored by varying the semi-major axis ae and the eccentricity ee. As in Fig. 13, the color scale shows D values between −6 and 2. The red zone corresponds to highly unstable orbits, while the dark blue region can be assumed to be stable on a billion-years timescale. The contour curves indicate the 2, 3, 5, 10σ confidence intervals from Δχ2. The best fit lies well inside a red chaotic region.
Current usage metrics show cumulative count of Article Views (full-text article views including HTML views, PDF and ePub downloads, according to the available data) and Abstracts Views on Vision4Press platform.
Data correspond to usage on the plateform after 2015. The current usage metrics is available 48-96 hours after online publication and is updated daily on week days.
Initial download of the metrics may take a while.