Fig. 5
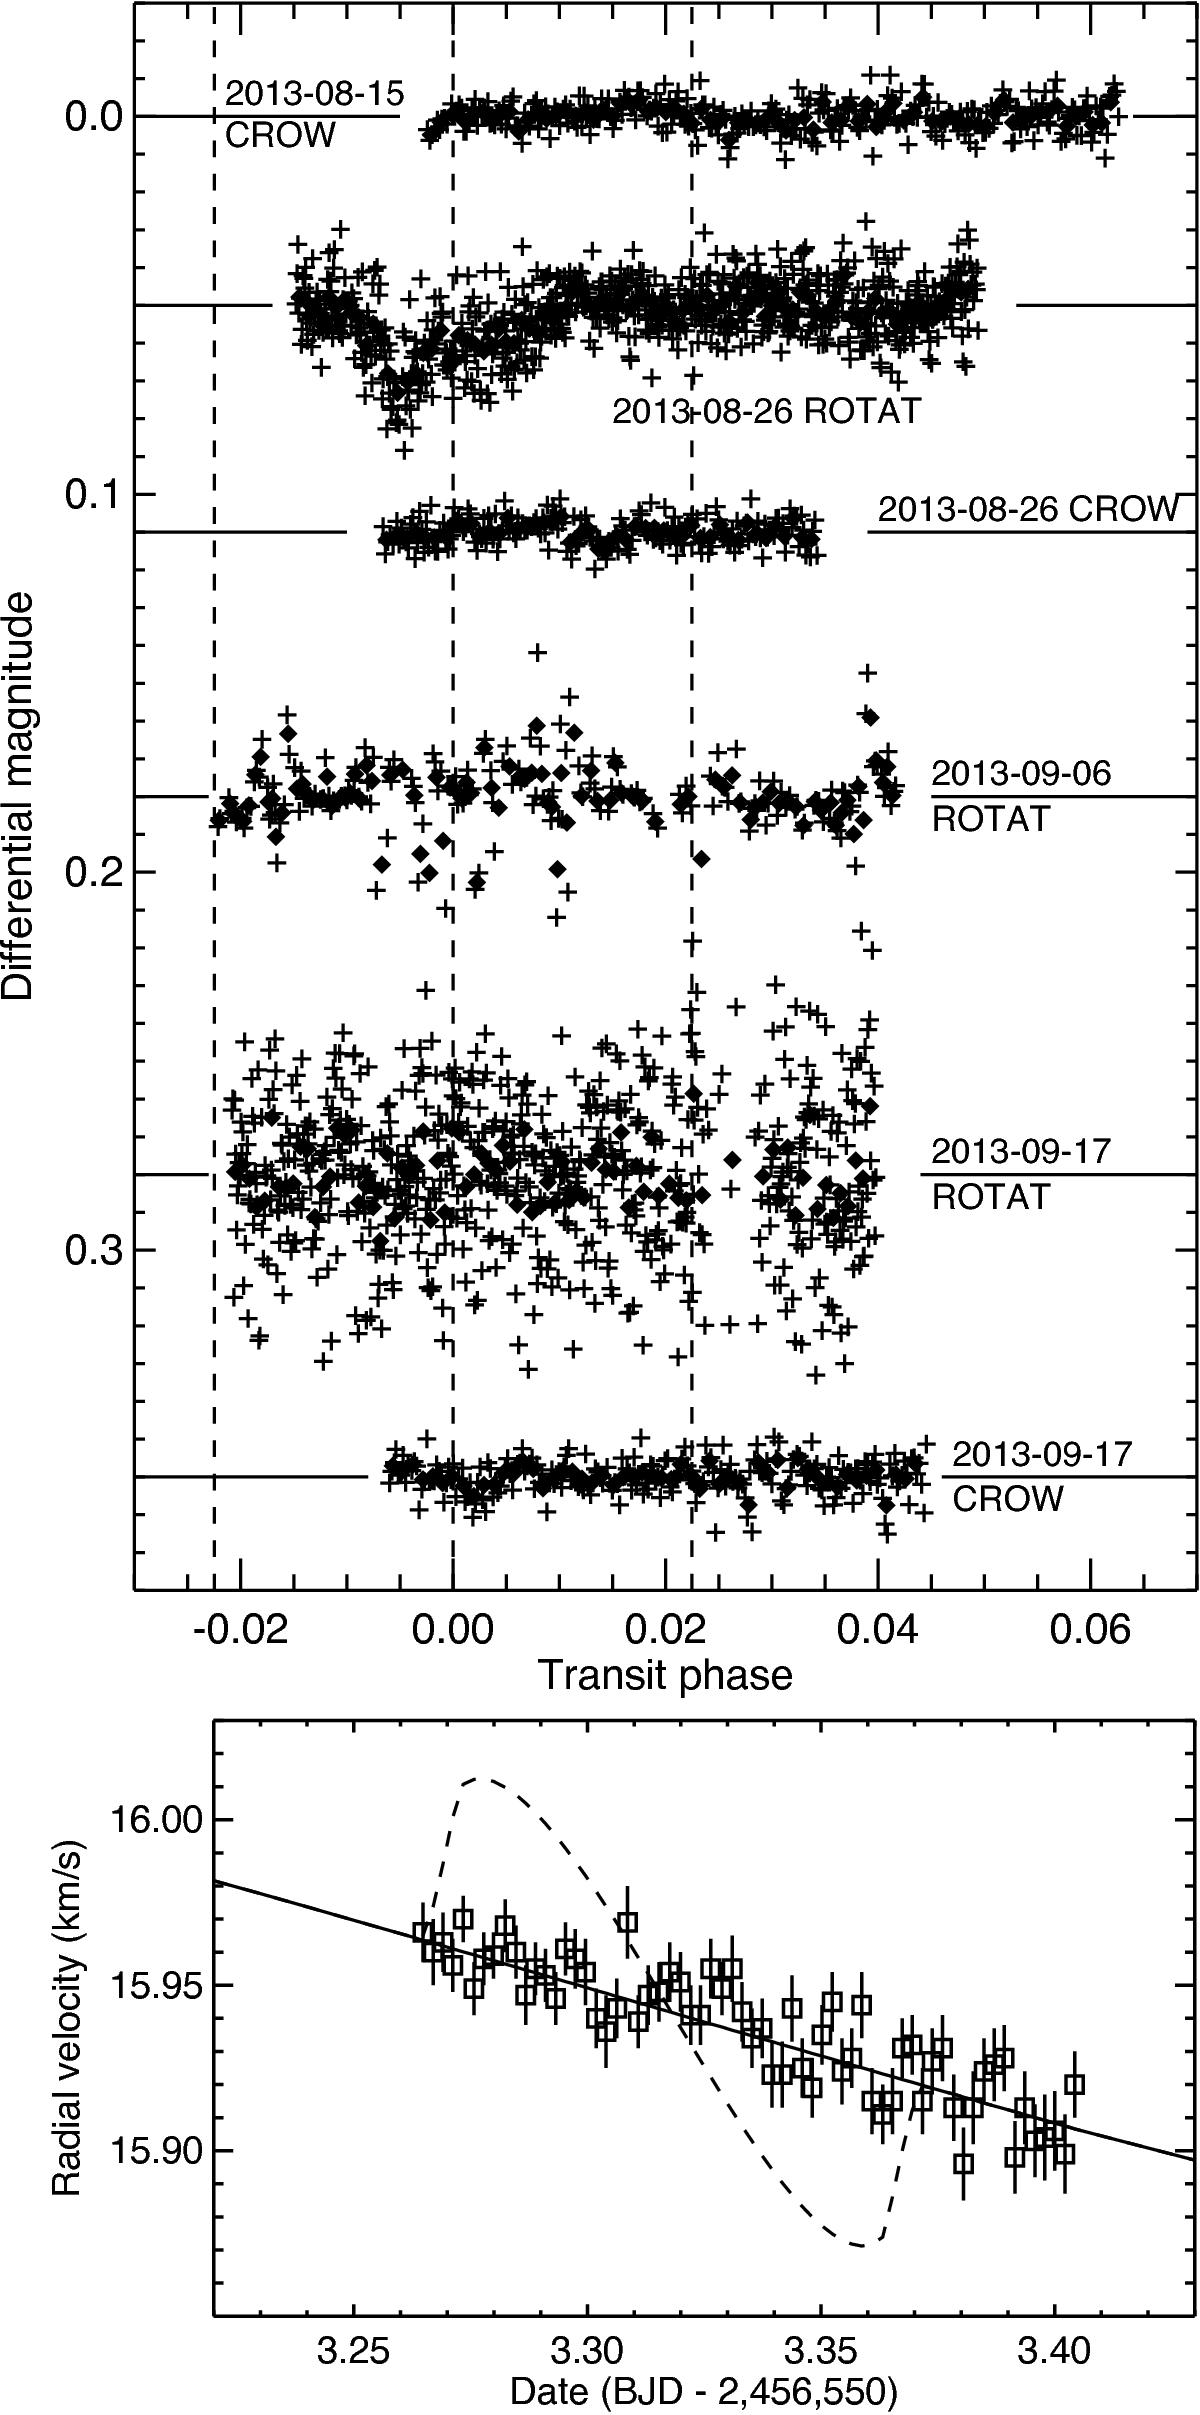
Search for transits of HD 143105b. Top: photometry. The differential photometry is plotted as a function of the phase of the searched transits. The telescopes (CROW or ROTAT) and the dates are indicated for each of the six observations, which have been shifted in y-axes for clarity. The horizontal lines represent the mean of the data (or mean outside the event for 2013-08-26 with ROTAT). The original data (plus signs) have been binned to have a point approximatively every 120 s (diamond signs) to facilitate the comparison. The vertical dashed lines represent the hypothetical ingress, center, and egress phases for central transits. The transit-like event observed on 2013-08-26 with ROTAT was not confirmed by other observations. Bottom: spectroscopy. SOPHIE radial velocities measured during a possible transit (2013-09-17). The expected Rossiter-McLaughlin anomaly is shown as a dotted line (for an aligned, prograde orbit); it is not detected. The solid line shows the Keplerian model with no transit (Figs. 2 and 4, Table 3).
Current usage metrics show cumulative count of Article Views (full-text article views including HTML views, PDF and ePub downloads, according to the available data) and Abstracts Views on Vision4Press platform.
Data correspond to usage on the plateform after 2015. The current usage metrics is available 48-96 hours after online publication and is updated daily on week days.
Initial download of the metrics may take a while.