| Issue |
A&A
Volume 587, March 2016
|
|
|---|---|---|
| Article Number | A146 | |
| Number of page(s) | 12 | |
| Section | Stellar structure and evolution | |
| DOI | https://doi.org/10.1051/0004-6361/201527701 | |
| Published online | 04 March 2016 | |
An alternative model for the origin of gaps in circumstellar disks
1
University of ViennaDepartment of Astrophysics,
1180
Vienna,
Austria
e-mail:
This email address is being protected from spambots. You need JavaScript enabled to view it.
2
Research Institute of Physics, Southern Federal
University, Stachki Ave.
194, 344090
Rostov-on-Don,
Russia
3
Konkoly Observatory, Research Centre for Astronomy and Earth Sciences, PO Box
67, 1525
Budapest,
Hungary
4
UCO/Lick Observatory, University of California,
Santa Cruz, CA
95064,
USA
Received: 5 November 2015
Accepted: 8 January 2016
Abstract
Aims. Motivated by recent observational and numerical studies suggesting that collapsing protostellar cores may be replenished from the local environment, we explore the evolution of protostellar cores submerged in the external counter-rotating environment. These models predict the formation of counter-rotating disks with a deep gap in the gas surface density separating the inner disk (corotating with the star) and the outer counter-rotating disk. The properties of these gaps are compared to those of planet-bearing gaps that form in disks hosting giant planets.
Methods. We employ numerical hydrodynamics simulations of collapsing cores that are replenished from the local counter-rotating environment and numerical hydrodynamics simulations of isolated disks hosting giant planets to derive the properties of the gaps that form in both cases.
Results. Our numerical simulations demonstrate that counter-rotating disks can form for a wide range of mass and angular momentum available in the local environment. The gap that separates both disks has a substantial depletion factor, can be located at a distance from ten to over a hundred AU from the star, and can propagate inward with velocity ranging from 1 AU Myr-1 to >100 AU Myr-1. Unlike our previous conclusion, the gap can therefore be a long-lived phenomenon that is, in some case, comparable to the lifetime of the disk itself. For a proper choice of the planetary mass, the viscous α-parameter and disk mass, the planet-bearing gaps and gaps in counter-rotating disks may show a remarkable similarity in the gas density profile and depletion factor, which may complicate their observational differentiation.
Key words: protoplanetary disks / stars: formation / stars: protostars / hydrodynamics
© ESO, 2016
1. Introduction
In the classic scenario for star formation, stars form from the gravitational collapse of dense molecular cloud cores described by isolated Bonnor-Ebert-type spheres or truncated singular isothermal spheres (Larson 1969; Shu 1977). If the core has non-zero angular momentum, then a fraction of its mass lands onto a circumstellar disk formed owing to conservation of the net angular momentum of the core. In this scenario, stars and disks accrete material from isolated parental cores until the latter are depleted or dispersed via feedback from stellar irradiation and outflows.
However, there is growing evidence that forming young stellar objects may be constantly or periodically replenished from the external environment. A sizeable fraction of cores appear to form not in isolation, but within dense and rich large-scale structures. For instance, recent Herschel and IRAM images show that dense cores often lie along sinuous filaments, like beads in a string (André et al. 2014; Tafalla & Hacar 2015), implying an interesting possibility for prolonged accretion from these filamentary structures.
This assumption seems to be supported by recent analytical, numerical, and observational studies. For instance, the usually referred mean age of 2–3 Myr for circumstellar disks (Mamajek 2009) might in fact be considerably underestimated as a result of selection criteria that focus on the densest parts of stellar clusters (most prone to disk erosion) and leave out field stars (Pfalzner et al. 2014). There is also a wide spread in the disk lifetimes; some objects lose their disks very early (≤1.0 Myr), whereas other objects retain their disks for up to 10 Myr and even longer (Beccari et al. 2010; Williams & Crida 2011; De Marchi et al. 2013). An implication for these findings is that the disk dispersal mechanisms, such as UV/X-ray photoevaporation, may act longer than was previously thought or circumstellar disks may be replenished from the external environment. Numerical hydrodynamic simulations of clustered star formation support the notion of prolonged accretion, showing that protostellar cores can be repeatedly replenished in response to fluctuating conditions in the surrounding environment (Maschberger et al. 2014; Padoan et al. 2014).
Motivated by these findings, we recently presented a numerical hydrodynamics study of collapsing cores embedded in an external environment with different magnitude and direction of rotation (Vorobyov et al. 2015). Our major conclusion was that the evolution of stars and circumstellar disks in isolated and nonisolated systems may be drastically different. The most curious case was found for the model with opposite spin directions of the core and external environment. This peculiar system demonstrated the formation of counter-rotating disks separated by a deep gap in the gas surface density, resembling somewhat in morphology the AB Aurigae system also seemingly showing the signs of prolonged accretion and counter-rotating disk structures (Tang et al. 2012).
The formation scenario for counter-rotating disks requires a source of material, which i) has a spin direction that is opposite (in general) that of the disk and ii) can accrete onto the disk sometime after its formation. The star-forming turbulent and chaotic environment may naturally provide such an environment. Indeed, numerical simulations of clustered star formation demonstrate that protostellar cores can be regularly replenished in response to the fluctuating conditions in the local environment (Maschberger et al. 2014) and the angular momentum vector of the accreted material can undergo significant changes both in magnitude and direction with respect to the star (Bate et al. 2010; Fielding et al. 2015), often leading to the formation of misaligned star-disk systems in some cases exceeding 90°. Recent observations of wide-separation (>1000 AU) binary/multiple systems in the Perseus star-forming region revealed that the distribution of the outflow directions is consistent with preferentially random or even antialigned distributions, implying that these systems possibly formed in environments where the distribution of angular momentum is complex and disordered, rather than corotating or aligned (Lee et al. 2016).
Moreover, the recent numerical magnetohydrodynamics simulations of the core collapse and disk formation, taking the Hall effect into account, suggest that the outer envelope can change its rotation direction to the opposite direction with respect to the disk if the rotation vector of the parental core and magnetic field are antiparallel (Tsukamoto et al. 2015). If the outer envelope remains gravitationally bound to the system, its subsequent infall onto the disk can serve as a source of external counter-rotating material.
In this paper, we perform an in-depth analysis of counter-rotating disks formed as a result of gravitational collapse of rotating cores embedded in an external environment with the opposite direction of rotation. We compare the properties of gaps in counter-rotating disks with those typically found in planet-bearing disks. The paper is organized as follows. In Sect. 2, the model description and initial conditions are provided. The formation of counter-rotating disks is described in Sect. 3 and the properties of the gaps are provided in Sect. 4. A comparison with planet-bearing gaps is performed in Sect. 5 and our main conclusions are summarized in Sect. 6.
2. Model description and initial conditions
Our numerical model for the formation and evolution of counter-rotating disks is described in detail in Vorobyov et al. (2015) and is briefly reviewed here. Numerical hydrodynamics simulations start from a collapsing prestellar core embedded into an external low-density environment. Because the density of the core is much higher than that of the external environment, the free-fall time of the core is short and the dynamics is initially dominated by contraction of the core and formation of the star plus disk system from the core material.
Once the mass reservoir in the core has depleted, the material from the external environment starts falling onto the star plus disk system and the subsequent evolution is determined by the mass and angular momentum in the external environment. In this paper, we consider a special case of external environment counter-rotating with respect to the spin of the prestellar core.
The main physical processes taken into account when modeling the formation and evolution of counter-rotating disks include viscous and shock heating, irradiation by the forming star, background irradiation (10 K), radiative cooling from the disk surface, and disk self-gravity. In particular, the stellar irradiation is taken into account by calculating the amount of stellar flux intercepted by the disk/envelope. To do this, the incidence angle of stellar radiation is calculated from the shape of the disk surface using the local vertical scale height and the assumption of vertical hydrostatic balance. The possible self-shading of the disk/envelope is not taken into account. The viscosity is calculated using the α-parameterization of Shakura & Sunyaev (1973) with the α-value varying between 10-3 and 10-2. With these assumptions, the viscous and irradiation heating scale as r-3 and r-1.75, respectively, so that the former usually dominates in the inner several tens of AU (if α is not too low), but the latter always dominates in the outer disk1.
The pertinent equations of mass, momentum, and energy transport, and the solution procedure are described in Vorobyov et al. (2015). The forming star is described by the Lyon stellar evolution code (Baraffe et al. 2012), while the formation and long-term evolution of the circumstellar disk are described using numerical hydrodynamics simulations in the thin-disk limit. To avoid time steps that are too small, we introduce a “sink cell” at rsc = 6.0 AU and impose a free outflow boundary condition so that the matter is allowed to flow out of the computational domain, but is prevented from flowing in.
For the initial setup, we take a prestellar core submerged into a constant-density external environment. For the initial surface density profile of the core, we adopt a simplified form of a vertically integrated Bonnor-Ebert sphere (Dapp & Basu 2009). The resulting initial distribution of the gas surface density takes the following form: 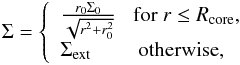 where Σ0 is the gas surface density at the center of the core,
  is the radius of the central plateau of the core, Rcore is the radius of the core, and cs is the initial sound speed. We assume a fixed shape of our cores with Rcore/r0 = 6. The radius of the core Rcore is a free parameter. Once it is fixed, the size of the central plateau r0 is also fixed and Σ0 can be found using the above expression for r0, thus completing the procedure for generating the gas surface density distribution of individual cores. Further, the density of the external environment Σext is set equal to the gas surface density at the outer edge of the core (
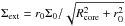 ). In all models, the value of A is set to 1.2 and the initial temperature is set to 10 K.
To study the formation of counter-rotating disks, we adopt the following form for the initial radial profile of angular velocity Ω: 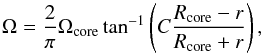 (1)where Ωcore is the angular velocity of the core and C = 25 the dimensionless factor defining the sharpness of the transition zone between the core and counter-rotating external environment. When r is much smaller than Rcore, Ω approaches Ωcore.
We considered three models, the initial configurations for which are shown in Fig. 1. In particular, the left panels present the radial distribution of Σ, while the right panels show Ω as a function of radial distance. In all models, the core rotates counter-clockwise, while the external environment rotates clockwise. The parameters of every model are provided in Table 1. All three models have similar integrated properties of the core, albeit with some variations in the radial density profiles2, but differ significantly in the characteristics of the external environment. In particular, they have different masses Mext and different ratios of rotational to gravitational energy βext in the external environment, while the corresponding quantities in the core (Mcore and βcore) are the same. In our previous study (Vorobyov et al. 2015), the mass of the core was lower than that contained in the external environment. In this study, we consider the opposite initial configuration in which the mass contained in the core is higher than that in the external environment. We note that both the core and external environment are initially out of virial equilibrium (| Egrav | > 2Eth + Erot) and both undergo gravitational contraction after the start of the numerical simulations.
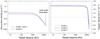 |
Fig. 1 Initial distribution of the gas surface density (left) and angular velocity (right) in three considered models. |
3. Formation of counter-rotating disks
Model parameters.
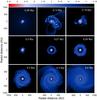 |
Fig. 2 Gas surface density in the inner 2000 × 2000 AU2 box in model 1. The time elapsed since the formation of the protostar (located in the coordinate center) is shown in each panel. The scale bar is in g cm-2 (log 10 units). |
The formation of counter-rotating disks is demonstrated in Fig. 2 showing the time evolution of the gas surface density in model 1. We zoom in onto the inner 2000 × 2000 AU2 box where the most interesting effects take place, but the total computational domain is 20 000 × 20 000 AU2 in size. The time elapsed since the formation of the central protostar is shown in each panel.
The initial configuration is gravitationally unstable and collapses to form a central protostar. However, because the gas density is higher in the core than in the external environment, the former collapses faster than the latter. After several thousands years, a centrifugally balanced disk forms and grows in size and mass owing to the continuing inflow of matter from the collapsing core. In this early phase, the disk corotates with the core. However, at t ≈ 0.14 Myr the disk growth halts when the mass reservoir in the collapsing core exhausts and the material from the collapsing counter-rotating external environment starts falling onto the disk outer regions. This infalling material mixes with the disk, reducing its net angular momentum and causing the disk to shrink by a factor of several by t = 0.2 Myr. We note that the infall of external material is not modeled by adding material at certain radii with a given mass and angular momentum rate, but rather through self-consistent numerical hydrodynamics simulations covering both the disk and external environment contracting gravitationally toward the disk on the same numerical mesh.
To better illustrate the effect of infall from the external environment, we show in Fig. 3 the angular velocity by absolute value | Ω | (upper panel) and the gas surface density Σ (lower panel) as a function of radial distance from the star. Both | Ω | and Σ are azimuthally averaged. Four time instances are denoted by lines of different color as shown in the legend. In the upper panel, the solid/dashed lines represent positive/negative values of Ω. The inner regions rotate counter-clockwise (positive Ω), while the outer regions rotate clockwise (negative Ω). A sharp drop in | Ω | manifests a radial position where the counter-rotating external environment mixes with the inner core/disk, resulting in a net decrease in | Ω |.
The upper panel in Fig. 3 demonstrates that the interface between the external environment (dashed lines) and the inner material constituting the core and the disk (solid lines) moves radially inward with time. At t ≤ 0.14 Myr, the position of the interface is still far away from the disk outer edge, which is schematically indicated in the lower panel with filled circles. As a result, the disk grows in size during the early evolution thanks to continuing accretion of corotating material from the collapsing core. However, once the core has almost completely accreted onto the disk plus star system, the material from the counter-rotating external environment starts landing onto and mixing with the disk. The disk shrinks in size as indicated by the arrow in the lower panel. During t = 0.19−0.20 Myr, the size of the disk is determined by the current position of the interface between the disk and the infalling external material.
The subsequent evolution of the system (t ≥ 0.21 Myr) reveals an interesting effect: The formation of two counter-rotating disks separated by a deep gap. This phenomenon, first noted in Vorobyov et al. (2015), is illustrated in Fig. 4 showing the gas velocity field (yellow arrows) superimposed on the gas surface density map at t = 0.24 Myr. The inner disk rotates counter-clockwise, in the same direction as the initial rotation of the parental core, while the outer disk rotates clockwise, in the same direction as the external environment. As time passes, the outer disk gradually grows in size owing to infall of the external material, while the inner disk shrinks owing to accretion onto the star.
The formation of the outer counter-rotating disk, which can be understood if we consider the centrifugal radius of matter initially located at a distance r from the star3, is written as 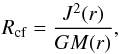 (2)where J(r) = r2 | Ω | is the specific angular momentum at a radial distance r, G is the gravitational constant, and M(r) it the mass enclosed within distance r. The centrifugal radius provides a distance at which the gravitational acceleration acting on a contracting layer of rotating material becomes balanced by its centrifugal acceleration, preventing the layer from further contraction. The radial distribution of Rcf in model 1 at the onset of gravitational contraction (t = 0) is shown in Fig. 5. The centrifugal radius gradually increases with distance and reaches a local maximum at the location of the core outer edge (shown by the arrow). In the transition zone between the core and the counter-rotating external environment, the angular velocity changes its sign and the centrifugal radius drops to a negligible value. In the counter-rotating external environment, the angular velocity increases again, although with the opposite sign. As a consequence, the centrifugal radius of the external environment increases and attains values that are even larger than those of the core.
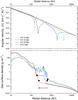 |
Fig. 3 Top: azimuthally-averaged angular velocity | Ω | (by absolute value). The positive/negative values are plotted by solid/dashed lines. A sharp drop in | Ω | indicates the radial position where the rotation changes its direction from counter-clockwise to clockwise. Bottom: azimuthally-averaged gas surface density. The solid circles indicate the position of the outer disk edge. The arrow shows the direction in which the disk shrinks thanks to the infall of external counter-rotating material. |
The disk evolution reflects the behavior of the centrifugal radius shown in Fig. 5. First, the disk grows in size owing to accretion of material with a gradually increasing Rcf (the value of which serves as a proxy for the disk radius). The centrifugal radius of the material at the core outer edge is ≈200 AU. The disk at this stage is somewhat larger owing to gravitational interaction between spiral arms and fragments, which leads to gravitational scattering of the fragments and effective increase of the disk radius. The growth of the disk is followed by tentative contraction when the low-Rcf material from the transition zone lands onto the disk and starts extracting disk’s angular momentum. Finally, the outer counter-rotating disk begins to form when the infalling external material characterized by large Rcf hits the centrifugal barrier just outside the heavily reduced inner disk. The transition region between the inner and outer disks, where rotation changes its direction and the matter lacks centrifugal support, is manifested by a density gap clearly visible in Fig. 2 at t ≥ 0.21 Myr.
Now, we briefly discuss the formation of counter-rotating disks separated by a gap in the other two models we consider. Figure 6 demonstrates the formation of the counter-rotating disks in model 2, which is characterized by a somewhat smaller available mass reservoir in the external environment than in model 1 (see Table 1). The time elapsed since the formation of the star (located in the coordinate center) is shown in each panel. The evolution in model 2 follows a path similar to that of model 1: the initial growth of the disk is followed by its contraction and formation of a counter-rotating outer disk. However, the outer disk and gap are initially much more eccentric than in model 1.
To illustrate this peculiar feature of model 2, we calculated the eccentricity as 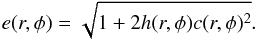 (3)In Eq. (3), c(r,φ) and h(r,φ) stand for
  (4)and
  (5)where vx(r,φ), vy(r,φ), and x(r,φ), y(r,φ) are the Cartesian velocity components and coordinates at the polar grid with coordinates (r,φ).
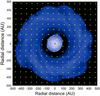 |
Fig. 4 Gas velocity field superimposed on the gas surface density map in model 1 at t = 0.24 Myr. Two counter-rotating disks are clearly visible. |
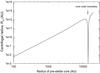 |
Fig. 5 Centrifugal radius Rcf as a function of radial distance in model 1 at the onset of gravitational contraction (t = 0). The arrow indicates the position of the core outer boundary. |
Figure 7 presents the map and azimuthally averaged profile of the eccentricity in model 2 for the inner 400 × 400 AU2 box. The snapshot is taken at t = 0.53 Myr. Evidently, the eccentricity is excited in the vicinity of the gap edges with a peak value of epeak ≈ 0.6 at the gap inner wall. We emphasize that the disk eccentricity profile is similar to that of a giant-planet-bearing disk (i.e., the eccentricity has a peak inside the gap), although the eccentricity of the giant-planet-bearing disk has a somewhat lower amplitude at the peak value, epeak ≈ 0.3 (Regaly et al. 2010). Because of the high disk eccentricity, we expect strong kinematical signatures similar to those of young binaries predicted by Regaly et al. (2011).
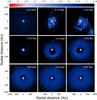 |
Fig. 6 Similar to Fig. 2 only for model 2. The yellow circle outlines the fragment ejected from the inner disk. |
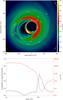 |
Fig. 7 Eccentricity distribution in the disk (upper panel) and the azimuthally averaged eccentricity (lower panel) for model 2 calculated using Eqs. (3)–(5) at 0.24 Myr. The red line in the lower panel provides the azimuthally averaged gas surface density profile. |
We propose the following explanation for the formation of such an eccentric outer disk. The initial distribution of gas in the external environment is homogeneous and axisymmetric, so the initial conditions cannot be responsible for the resulting eccentricity. We think that high eccentricity of the gap and its edges is caused by the gravitational perturbation from the strongly asymmetric structure of the inner disk. Indeed, the early evolution of the inner disk is characterized by the presence of extended asymmetric spiral arcs. There is also a massive fragment (≈25−30 MJup) outlined by the yellow circle in the bottom-right corner of Fig. 6 at t = 0.23 Myr, which is likely ejected from the disk via multibody interaction with other fragments. These strong azimuthal distortions may cause strong perturbations to the infalling external material, which results in the development of the eccentric gap and outer disk. We note that the inner disks in model 1 and model 3 (see below) also exhibit a spiral structure and fragmentation before the formation of the outer disk, but nevertheless we do not see strong eccentricity developing in the outer disk during the evolution. This might be because models 1 and 3 have a factor of 2 greater mass reservoir in the external environment and, as a consequence, more massive outer disks, which are less prone to the eccentricity excitation than those of model 2. In any case, it appears that the outcome depends significantly on the available mass in the external environment, and on particular inner disk configuration, including the presence or absence of extended spiral arcs and ejected fragments, and therefore cannot be predicted a priori.
Figure 6 indicates that the eccentricity of the disk and the gap in model 2 seems to diminish with time. This is likely due to the absence of continuing gravitational perturbation caused by smooth density distribution of the inner disk. Indeed, the distribution of gas in the inner disk (after the formation of the outer disk) becomes nearly axisymmetric, likely as a result of disk contraction and associated heating, thus reducing the source of gravitational perturbation. As a result, the disk eccentricity is gradually damped by the viscous evolution.
Finally, in Fig. 8 we show the formation of counter-rotating disks in model 3. This model is characterized by a factor of 2 smaller value of β in the external environment than in model 1. Nevertheless, the overall evolution is similar to model 1, except that the gap appears to be somewhat narrower. We conclude that the gap can form for a wide range of physical parameters (masses, angular momenta) in the external environment. Another interesting phenomenon that can be seen in Fig. 8 is gravitational fragmentation in the outer counter-rotating disk at t = 0.3−0.4 Myr. A similar effect was also reported in Vorobyov et al. (2015). Although the fragment does not survive for long (which might be caused by insufficient numerical resolution), this phenomenon presents an interesting gateway for the formation of giant planets counter-rotating with respect to the host star.
4. Properties of the gaps
In this section, we consider the properties of the gaps formed in our models. Figure 9 presents the azimuthally averaged profiles of the gas surface density in three models. Only the late evolution times are considered. A deep gap in the gas surface density is evident between the inner and outer disks. In order to estimate the depth of the gap, we plot a tangent line connecting the radial density profiles in the inner and outer disks shown with the dotted lines. The depletion of the gap is then calculated as the ratio between the gas surface density given by the model and that given by the tangent, both calculated at the position of the gap’s deepest point. The arrow illustrates the gap depletion for model 1 at t = 0.4 Myr. Table 2 provides the time-averaged properties of the gaps.
Properties of the gaps
Evidently, the gaps are characterized by a wide range of radial positions, which may vary from a few tens of AU to more than a hundred AU. In particular, model 2 is characterized by the gap position that is roughly a factor of two further out than in the other two models. This is related to the fact that model 2 has the smallest external mass reservoir. The depletion factor △ Σgap in all models is rather strong, indicating a drop in the gas surface density by at least two orders of magnitude at the position of the gap. The strongest contrast between the models is found for the gap propagation velocity, which may vary from rather fast propagation in model 3 (AU Myr-1) to very slow inward motion in model 2 (<1 AU Myr-1). Model 3 is characterized by the smallest angular momentum in the external environment (β = 0.7). In our previous work (Vorobyov et al. 2015), we showed that infall of external material with low angular momentum exerts a strong negative torque onto the inner disk, which can lead to significant contraction or even complete dissipation of the inner disk. A similar effect takes place in model 3, promoting the contraction of the inner disk and increasing the gap propagation speed. Interestingly, model 2 with the slowest gap propagation velocity is also characterized by the greatest asymmetry in both the gap and outer disk shape. This implies a causal link between the shape of the gap and its propagation velocity.
In Vorobyov et al. (2015) it was claimed that the gaps formed in counter-rotating disks are short-lived (several tens of kyr), transient phenomena. This conclusion was based on the behavior of the gap in one model only. Our numerical simulations with a wider parameter space show that the gaps may be a long-lived phenomenon, lasting for at least several hundred of kyr and perhaps even longer.
Finally, we note that the slopes of the tangents in Fig. 9 lie in the αd = −[ 1.6:1.8 ] range, which is only slightly steeper than expected for young self-gravitating disks, αd = −1.5 (Vorobyov 2010; Rice et al. 2010), and significantly steeper than expected for more evolved, viscosity-dominated protoplanetary disks with the kinematic viscosity proportional to the disk radius, αd = −1.0 (Lynden-Bell & Pringle 1974; Williams & Crida 2011).
5. Comparison with planet-bearing gaps
In this section, we compare the properties of gaps formed in counter-rotating disks with those that can be found in disks with embedded planets. A massive planet clears the disk around it to form a gap through gravitational interaction if its Hill radius is greater than the local disk scale height and the timescale for the gap opening is shorter than the timescale for viscous diffusion to close it (Kley & Nelson 2012). To model the gap opening via planet-disk interaction, we employ the two-dimensional, numerical hydrodynamics simulations using the FARGO-ADSG code and also its GPU based version (Masset 2000). The FARGO code solves the vertically integrated continuity and Navier–Stokes equations numerically in the cylindrical coordinate system with the locally isothermal approximation.
In the local isothermal approximation, the radial temperature profile is T(r) ~ r-1, and the equation of state of the gas is 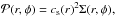 which depends only on the density and the local sound speed cs(r) = Ω(r)H(r), where H(r) is the local pressure scale height. Both cs(r) and H(r) are constant in time because of the assumption of local isothermality. The disk scale height is proportional to radius, H(r) = Ar, where A is the disk aspect ratio, which is set to A = 0.05 for all models.
The 2D computational domain extends from 6 AU to 1000 AU, consisting of NR = 256 logarithmically distributed radial, and Nφ = 512 equidistant azimuthal grid cells. For the smoothing length of the planet gravitational potential, we choose ϵH(Rp), where Rp is the position of the planet and ϵ = 0.6, which is appropriate for 2D simulations (Kley et al. 2012). The gas is allowed to flow out from the computational domain, i.e., an open boundary condition is applied at both the inner and outer domain boundaries. The disk viscosity is approximated by the α-prescription of Shakura & Sunyaev (1973). The magnitude of viscosity is varied in the range of 10-3 ≤ α ≤ 10-2. For comparison, in the counter-rotating disk simulations, the viscous α was set to a constant value of 5 × 10⁻³. We use a coordinate frame that corotates with the planet.
The initial density profile of the gas disk is Σ(R,φ) = Σ0R-1.5, where Σ0 is chosen so as to set the disk mass to ~0.03 M⊙ inside the computational domain. For this disk mass, the Toomre Q-parameter (Toomre 1964) is greater than three throughout the disk (Q ≃ 8.5 at the planetary distance). These high values of Q-parameter make it possible to neglect the disk’s self-gravity. We also consider models for which the disk mass is increased to ~0.3 M⊙. For those high-disk-mass models, the disk’s self-gravity is taken into account.
The planet is set on an orbit at 80 AU from the central star (to match the position of the gap in the counter-rotating disk model) and the planet is not allowed to migrate or accrete gas, i.e., it remains on a circular orbit with constant mass. The planet-to-star mass ratio are q = 0.9 × 10⁻³, 2.35 × 10⁻³, and 4.7 × 10⁻³ corresponding to 1, 2.5, and 5 Jupiter mass planets for a 1.0 solar mass central star. The planetary mass and disk viscosity were varied in a wide range to produce different configurations of the planet-bearing gaps. Our purpose is to determine the characteristic signatures of the gaps in counter-rotating disks, which can help to distinguish them from the planet-bearing gaps.
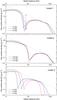 |
Fig. 9 Azimuthally averaged profiles of the gas surface density in models 1, 2, and 3 (from top to bottom). Only late evolution times, when the gap has fully developed, are shown. The dotted tangent lines connect the radial density profiles in inner and outer disks. The arrow illustrates the contrast in the gas surface density in the gap at t = 0.3 Myr. The time is counted from the formation of the central star. |
For a planet-bearing disk model, the density snapshots were taken at the end of the simulation (after 1000 orbits of the giant planet corresponding to 0.07 Myr after the planet was inserted to the disk), when a quasi -steady disk state had been achieved. In each row of Figs. 10–13, the first and second panels show the gas surface density distribution in the counter-rotating disk and planet-bearing disk models. The third panel shows the azimuthally averaged radial density profiles (black for counter-rotating, blue for planet-bearing disk models). For the counter-rotating disk model, we use the data for model 1 at t = 0.6 Myr. The densities in non-self-gravitating, planet-bearing models are scaled such that the density profile at the inner disk (R< 80 AU) fits to that of the counter-rotating disk model. We note that as long as the disk self-gravity and planetary migration are not taken into account, the density can be scaled as Σ0 can be canceled out from the continuity and Navier–Stokes equations.
Figure 10 shows the comparison of gaps in counter-rotating and planet-bearing disk models for the viscous α = 5 × 10⁻³ and the planet mass of Mp = 5 (upper row) and Mp = 2.5 (lower row) Jupiters. The surface density in the planet-bearing model is scaled up by a factor of 50 to match the peak density in the inner disk of the counter-rotating disk model4. We found that the lower Mp = 2.5MJup model seems to match the azimuthally averaged density profiles in the inner disk slightly better, including the density contrast between the inner disk edge and the center of the gap, whereas both planet-bearing models are characterized by a smaller contrast between the peak densities in the inner and outer disks. As a consequence, the depletion in planet-bearing gaps is significantly stronger than in the case of counter-rotating disks, 0.02% for 5 MJup and 0.08% for 2.5 MJup planet as compared to 0.14% in model 1.
Figure 11 shows the effect of viscosity on the gas density distribution in planet-bearing disk models with different values of α = 10-2 (upper row) and α = 10-3 (lower row). The planet mass in both cases is set to Mp = 2.5MJup. For both models, we applied a density scaling factor of 130 and 20 to match the inner density profile of the counter-rotating disk model. The model with a higher α = 10-2 demonstrates a significantly shallower gap (the depletion factor is 0.37%) than its low-α counterpart (0.002%) thanks to an increased viscous transport. As a consequence, the gap depth in the α = 10-2 model fits better to that of the counter-rotating disk model.
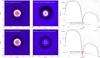 |
Fig. 10 Comparison of gap formation in counter-rotating disks and a giant plant bearing protoplanetary disk assuming 5 MJup (upper row) and 2.5 MJup (lower row) planetary mass, respectively. Left panel: density distribution in the counter-rotating disk models at 0.6 Myr. Middle panel: density distribution in giant planet bearing disk model after 1000 orbits of the giant planet. Right panel: comparison of azimuthally averaged density profiles for both models. The density is scaled up by 50 in planet-bearing disk model to match the density profiles in the inner disk. |
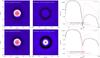 |
Fig. 11 Same as Fig. 10, but the viscosity is changed to α = 10-2 (upper row) and α = 10-3 (lower row). The applied density scalings are 130 (upper row) and 20 (lower row). |
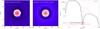 |
Fig. 12 Same as the lower panel of Fig. 11 (α = 10-3), but the planetary mass is decreased further to 1MJup. The applied density scaling is 20. |
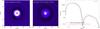 |
Fig. 13 Same as in Fig. 12, but in models where the disk mass is assumed to be ten times higher, therefore self-gravity is taken into account. No density scaling is applied. |
To better match the density depletion inside the gap, the planetary mass was further decreased to 1.0 MJup. The corresponding density distribution is shown in Fig. 12. For this case, the proper density scaling for the planet-bearing model was found to be 20. With 1.0 MJup for the planetary mass and 10-3 for the viscous α, the inner disk density profiles, including the depletion factor in the gap (0.24%), are found to match those of the counter-rotating disk model 1 better than in previously considered planet-bearing models. Nevertheless, the gap in the planet-bearing disk model still has sharper edges than those of the counter-rotating disk model.
It appears that for the case of giant planet-bearing, non-self-gravitating disks, the gaps tend to be deeper than those of the counter-rotating disks unless the viscosity is high (α = 10-2) or the planetary mass is low (~1 MJup). The density peak at the gap outer edge in the planet-bearing model is always higher, implying that a pressure maximum is much better expressed in planet-bearing disks than in counter-rotating disks. In addition, the slope of the planet-bearing disk is usually shallower than that of the counter-rotating disk. For instance, the planet-bearing disks in Fig. 10 and in the top panel of Fig. 11 have slopes that lie in the αd = −[ 0.9:1.15 ] limits. The planet-bearing disks in the bottom panel of Fig. 11 and in Fig. 12 have somewhat steeper slopes, αd ≈ −1.5, but still shallower than those of the counter-rotating disks, αd = −[ 1.6:1.8 ]. Taking a steeper initial gas surface density distribution in the planet-bearing disk could help to bring the resulting slope in a better agreement with the counter-rotating disk, but we note that we have already taken a rather steep initial surface density profile, Σ r-1.5, and increasing it even further may be difficult to justify.
In order to check the effect of disk self-gravity, additional simulations were done using ten times higher disk mass (similar to that of the counter-rotating model 1) than previously considered. We note that in simulations with disk self-gravity the density scaling was not applied. For the viscous α and planetary mass, we chose 10-3 and 1.0 MJup, respectively. As one can see in Fig. 13, the density profile of the inner and outer disks match those of the counter-rotating disk model rather well. Significant differences are only found for the innermost disk region, where the surface density of the planet-bearing disk has a notable excess, and also at the center of the gap, where the planet-bearing disk has weaker depletion (2.5%). The difference in the innermost disk is likely related to different boundary conditions applied in the two numerical codes.
We note that the gap depth and structure of its edges are expected to be altered if the gas thermodynamic is taken into account. Moreover, as the presented snapshots were taken after 1000 planetary orbits, the orbital migration should also be taken into account presumably affecting the shape and radial position of the gap.
6. Conclusions
We numerically studied the formation and physical properties of circumstellar disks formed as a result of gravitational collapse of dense cloud cores submerged into a low-density external environment counter-rotating with respect to the core. We found that counter-rotating disks form during the evolution for a wide parameter space of masses and rotation rates in the external environment, with the inner disk corotating with the star and the outer disk counter-rotating with respect to both the inner disk and the star. The inner and outer disks are separated by a deep gap in the gas surface density. The gap shape, its depth and eccentricity may vary depending on the model. The gap often migrates inward but the migration speeds are vastly different, ranging from more than a hundred AU per Myr to less than one AU per Myr, suggesting that this structure may be a long-lived phenomenon, which is comparable to the lifetime of the disk itself.
We compared the properties of the gap in counter-rotating disks with those formed as a result of a gap opening in a giant-planet-bearing disk. We found that the shape of the inner disk in both gap-opening mechanisms can be rather similar. Moreover, given a proper choice of the planetary mass and viscous α-parameter (1.0 MJup and 10-3, respectively) and considering relatively massive (self-gravitating) disks, the shape and depth of the gap in planet-bearing models can match those of counter-rotating disks rather well. Therefore, the shape of the gas surface density profile in massive planet-bearing disks may resemble that of counter-rotating disks, which makes it difficult to distinguish between the two gap-forming mechanisms based solely on the gas density distribution. This implies that planet-bearing gaps may be confused with gaps formed in counter-rotating disks and gas kinematic studies are necessary to distinguish between the two possible gap-forming mechanisms. Another potentially observable effect that can help to distinguish between the two gaps is the emission due to accretion onto the protoplanet. The Hα emission that was recently reported for the LkCa planetary system (Sallum et al. 2015) presents one possible example. The differences in the shape of the spiral pattern and the pitch angle may also be used to determine the origin of the gap, but this requires further investigation and synthetic image modeling as was carried out in, e.g., Juhász et al. (2015) and Dong et al. (2016).
At the same time, gaps in counter-rotating disks are as a rule distinct from those formed in planet-bearing models with low-mass (non-self-gravitating) disks. The latter often possess a deeper gap with sharper edges, implying stronger pressure bumps in the vicinity of the gap, which are subject to dust accumulation (see, e.g., Pinilla et al. 2012). Nevertheless, we expect that the peculiar density profile in the outer counter-rotating disk can also facilitate the dust growth in these regions, which can lead to an interesting perspective of forming a large population of planetesimals and solid protoplanetary cores counter-rotating to the star and inner disk.
The irradiation flux is determined as Firr = cosγirrL∗/ (4πr2), where L∗ is the stellar luminosity and the cosine of the incidence angle is proportional to H/r, where H is the vertical scale height. We assume here that H/r ∝ r0.25, but the slope in our models may vary somewhat around this value.
We note that the evolution of the core depends weakly on the gas surface density and angular velocity profiles, but is very sensitive to the integrated quantities such as its mass (Vorobyov 2012).
This equation is strictly valid for a point-mass object. However, our initial surface density distribution is similar to that of Mestel’s disk, Σ ∝ r-1, the gravitational potential of which is similar to that of the point-mass object with the point mass substituted by the mass located within a given radius r (Binney & Tremaine 1987). That is why Eq. (2) is also applicable to our models.
We scale Σ with a sole purpose of facilitating the comparison between the radial density profiles in different models. This scaling procedure is not meant for comparing the absolute values of the gas surface density, but only their ratios, such as the gap depletion factor.
Acknowledgments
We are thankful to the anonymous referee for very useful comments and suggestions that helped to improve the manuscript. This project was supported by the Austrian FWF through the NFN project grant S116 Pathways to Habitability and joint OeAD-OMA program through project 90öu25. E.I.V. acknowledges support from the Russian Ministry of Education and Science Grant 3.961.2014/K. Zs. R. acknowledges support from Momentum grant of the MTA CSFK Lendület Disk Research Group and the Hungarian Grant K101393. The simulations were performed on the Vienna Scientific Cluster (VSC-2), on the Shared Hierarchical Academic Research Computing Network (SHARCNET), on the Atlantic Computational Excellence Network (ACEnet). This publication is supported by the Austrian Science Fund (FWF). Zs. R. gratefully acknowledges the support of NVIDIA Corporation with the donation of the Tesla 2075 and K40 GPUs used for this research.
References
- André, P., Di Francesco, J., Ward-Thompson, D., et al. 2014, in Protostars and Planets VI, eds. H. Beuther et al. (University of Arizona Press), 914, 27 [Google Scholar]
- Baraffe, I., Vorobyov, E. I., & Chabrier, G. 2012, ApJ, 756, 118 [NASA ADS] [CrossRef] [Google Scholar]
- Bate, M., Lodato, G., & Pringle, J. E. 2014, MNRAS, 401, 1505 [Google Scholar]
- Beccari, G., Spezzi, L., De Marchi, G., et al. 2010, ApJ, 720, 1108 [NASA ADS] [CrossRef] [Google Scholar]
- Binney, J., & Tremaine, S. 1987, Galactic Dynamics (Princeton, NJ: Princeton Univ. Press) [Google Scholar]
- Dapp, W. B., & Basu, S. 2009, MNRAS, 395, 1092 [NASA ADS] [CrossRef] [Google Scholar]
- De Marchi, G., Beccari, G., & Panagia, N. 2013, ApJ, 775, 68 [NASA ADS] [CrossRef] [Google Scholar]
- Dong, R., Zhu, Z., Fung, J., Rafikov, R., Chiang, E., & Wagner, K. 2016, ApJ, 816, 12 [NASA ADS] [CrossRef] [Google Scholar]
- Fielding, D. B., McKee, C. F., Socratis, A., Cunningham, A. J., & Klein, R. I. 2015, MNRAS, 450, 3306 [NASA ADS] [CrossRef] [Google Scholar]
- Juhász, A., Benisty, M., Pohl, A., et al. 2015, MNRAS, 451, 1147 [NASA ADS] [CrossRef] [Google Scholar]
- Kley, W., & Nelson, R. P. 2012, ARA&A, 50, 211 [NASA ADS] [CrossRef] [Google Scholar]
- Kley, W., Muller, T. W. A., Kolb, S. M., Benitez-Llambay, P., & Masset, F. 2012, A&A, 546, A99 [NASA ADS] [CrossRef] [EDP Sciences] [Google Scholar]
- Larson, R. B. 1969, MNRAS, 145, 271 [NASA ADS] [CrossRef] [Google Scholar]
- Lee, K. I., Dunham, M., Myers, P. C., et al. 2016, ApJL, accepted [arXiv:1602.07397] [Google Scholar]
- Lynden-Bell, D., & Pringle, J. E. 1974, MNRAS, 168, 603 [NASA ADS] [CrossRef] [Google Scholar]
- Mamajek, E. E. 2009, in Exoplanets and Disks: Their Formation and Diversity, eds. T. Usuda, M. Tamura, & M. Ishii (Melville, NY: AIP), AIP Conf. Ser., 1158, 3 [Google Scholar]
- Maschberger, Th., Bonnell, I. A., Clarke, C. J., & Moraux, E. 2014, MNRAS, 439, 234 [NASA ADS] [CrossRef] [Google Scholar]
- Padoan, P., Haugbolle, T., & Nordlung, A. 2014, ApJ, 797, 32 [NASA ADS] [CrossRef] [Google Scholar]
- Pinilla, P., Benisty, M., & Birnstiel, T. 2012, A&A, 545, A81 [NASA ADS] [CrossRef] [EDP Sciences] [Google Scholar]
- Pfalzner, S., Steinhausen, M., & Menten, K. 2014, ApJ, 793, L34 [NASA ADS] [CrossRef] [Google Scholar]
- Regály, Zs., Sándor, Zs., Dullemond, C. P., & van Boekel, R. 2010, A&A, 523, A69 [NASA ADS] [CrossRef] [EDP Sciences] [Google Scholar]
- Regály, Zs., Sándor, Zs., Dullemond, C. P., & Kiss, L. L. 2011, A&A, 528, A93 [NASA ADS] [CrossRef] [EDP Sciences] [Google Scholar]
- Rice, W. K. M., Mayo, J. H., & Armitage, P. J. 2010, MNRAS, 402, 1740 [NASA ADS] [CrossRef] [Google Scholar]
- Shakura, N. I., & Sunyaev, R. A. 1973, A&A, 24, 337 [NASA ADS] [Google Scholar]
- Shu, F. 1977, ApJ, 214, 488 [NASA ADS] [CrossRef] [Google Scholar]
- Sallum, S., Follette, K. B., Eisner, J. A., et al. 2015, Nature, 527, 342 [NASA ADS] [CrossRef] [Google Scholar]
- Tafalla, M., & Hacar, A. 2015, A&A, 574, A104 [NASA ADS] [CrossRef] [EDP Sciences] [Google Scholar]
- Tang, Y.-W., Guilloteau, S., Piétu, V., et al. 2012, A&A, 547, A84 [NASA ADS] [CrossRef] [EDP Sciences] [Google Scholar]
- Toomre, A. 1964, ApJ, 139, 1217 [NASA ADS] [CrossRef] [Google Scholar]
- Tsukamoto, Y., Iwasaki, K., Okuzumi, S., Machida, M. N., & Inutsuka, S. 2015, ApJ, 810, L26 [NASA ADS] [CrossRef] [Google Scholar]
- Vorobyov, E. I. 2010, ApJ, 723, 1294 [NASA ADS] [CrossRef] [Google Scholar]
- Vorobyov, E. I. 2012, Astron. Rep., 56, 179 [NASA ADS] [CrossRef] [Google Scholar]
- Vorobyov, E. I., Lin, D. N. C., & Guedel, M. 2015, A&A, 573, A12 [Google Scholar]
- Williams, J. P., & Crida, L. A. 2011, ARA&A, 49, 67 [NASA ADS] [CrossRef] [Google Scholar]
All Tables
All Figures
|
Fig. 1 Initial distribution of the gas surface density (left) and angular velocity (right) in three considered models. |
| In the text | |
|
Fig. 2 Gas surface density in the inner 2000 × 2000 AU2 box in model 1. The time elapsed since the formation of the protostar (located in the coordinate center) is shown in each panel. The scale bar is in g cm-2 (log 10 units). |
| In the text | |
|
Fig. 3 Top: azimuthally-averaged angular velocity | Ω | (by absolute value). The positive/negative values are plotted by solid/dashed lines. A sharp drop in | Ω | indicates the radial position where the rotation changes its direction from counter-clockwise to clockwise. Bottom: azimuthally-averaged gas surface density. The solid circles indicate the position of the outer disk edge. The arrow shows the direction in which the disk shrinks thanks to the infall of external counter-rotating material. |
| In the text | |
|
Fig. 4 Gas velocity field superimposed on the gas surface density map in model 1 at t = 0.24 Myr. Two counter-rotating disks are clearly visible. |
| In the text | |
|
Fig. 5 Centrifugal radius Rcf as a function of radial distance in model 1 at the onset of gravitational contraction (t = 0). The arrow indicates the position of the core outer boundary. |
| In the text | |
|
Fig. 6 Similar to Fig. 2 only for model 2. The yellow circle outlines the fragment ejected from the inner disk. |
| In the text | |
|
Fig. 7 Eccentricity distribution in the disk (upper panel) and the azimuthally averaged eccentricity (lower panel) for model 2 calculated using Eqs. (3)–(5) at 0.24 Myr. The red line in the lower panel provides the azimuthally averaged gas surface density profile. |
| In the text | |
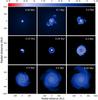 |
Fig. 8 Similar to Fig. 2, only for model 3. |
| In the text | |
|
Fig. 9 Azimuthally averaged profiles of the gas surface density in models 1, 2, and 3 (from top to bottom). Only late evolution times, when the gap has fully developed, are shown. The dotted tangent lines connect the radial density profiles in inner and outer disks. The arrow illustrates the contrast in the gas surface density in the gap at t = 0.3 Myr. The time is counted from the formation of the central star. |
| In the text | |
|
Fig. 10 Comparison of gap formation in counter-rotating disks and a giant plant bearing protoplanetary disk assuming 5 MJup (upper row) and 2.5 MJup (lower row) planetary mass, respectively. Left panel: density distribution in the counter-rotating disk models at 0.6 Myr. Middle panel: density distribution in giant planet bearing disk model after 1000 orbits of the giant planet. Right panel: comparison of azimuthally averaged density profiles for both models. The density is scaled up by 50 in planet-bearing disk model to match the density profiles in the inner disk. |
| In the text | |
|
Fig. 11 Same as Fig. 10, but the viscosity is changed to α = 10-2 (upper row) and α = 10-3 (lower row). The applied density scalings are 130 (upper row) and 20 (lower row). |
| In the text | |
|
Fig. 12 Same as the lower panel of Fig. 11 (α = 10-3), but the planetary mass is decreased further to 1MJup. The applied density scaling is 20. |
| In the text | |
|
Fig. 13 Same as in Fig. 12, but in models where the disk mass is assumed to be ten times higher, therefore self-gravity is taken into account. No density scaling is applied. |
| In the text | |
Current usage metrics show cumulative count of Article Views (full-text article views including HTML views, PDF and ePub downloads, according to the available data) and Abstracts Views on Vision4Press platform.
Data correspond to usage on the plateform after 2015. The current usage metrics is available 48-96 hours after online publication and is updated daily on week days.
Initial download of the metrics may take a while.