Free Access
Fig. 2
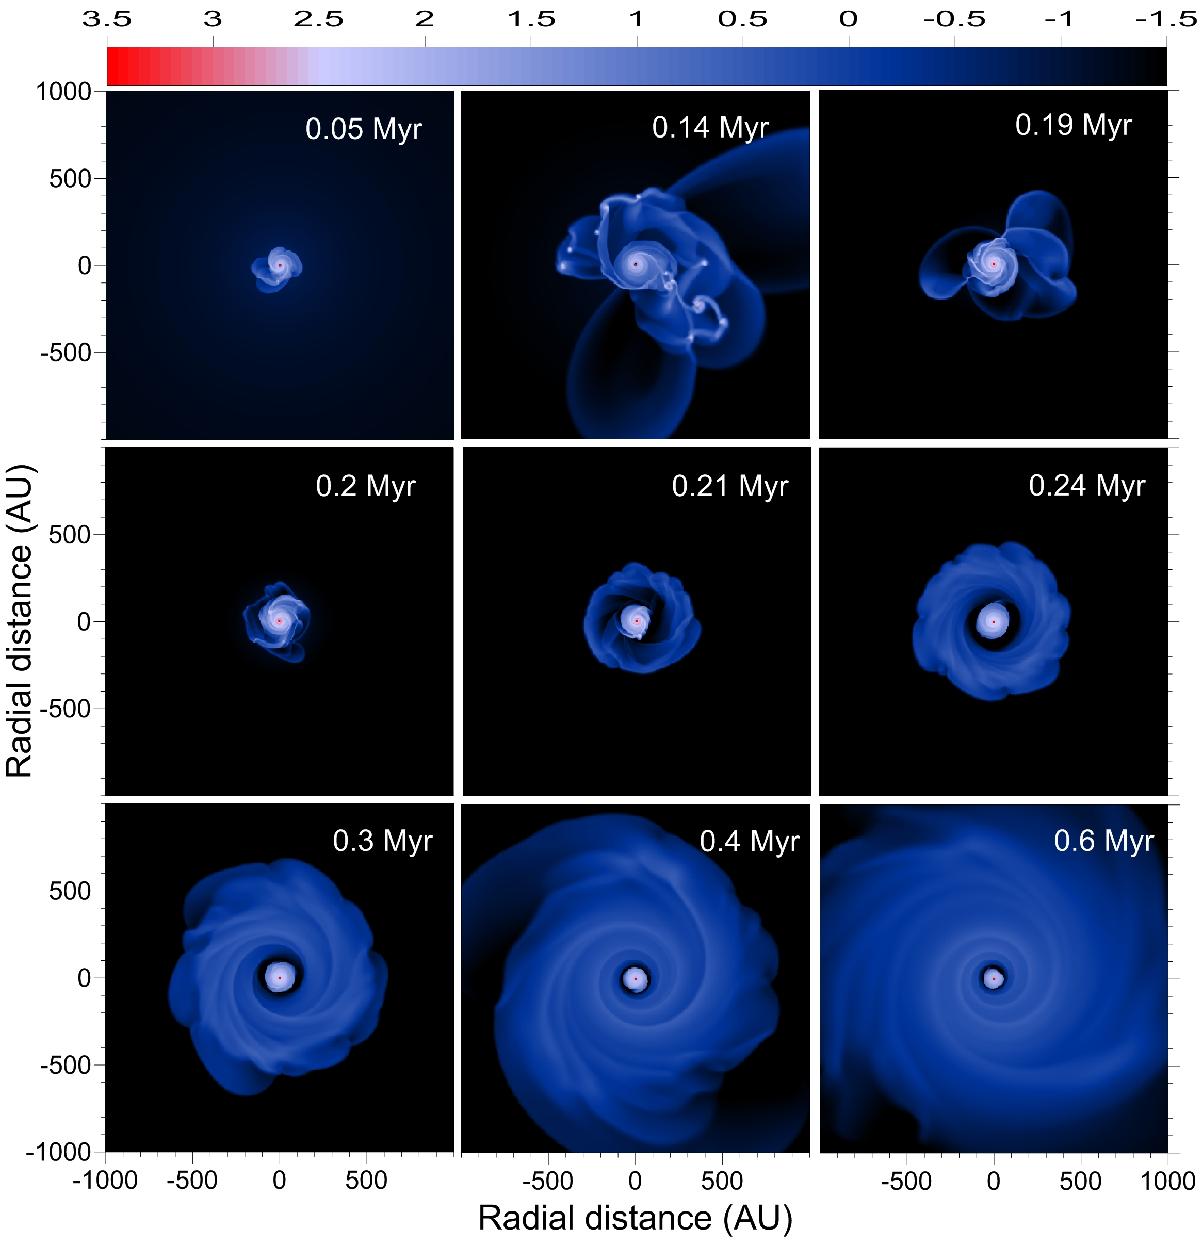
Gas surface density in the inner 2000 × 2000 AU2 box in model 1. The time elapsed since the formation of the protostar (located in the coordinate center) is shown in each panel. The scale bar is in g cm-2 (log 10 units).
Current usage metrics show cumulative count of Article Views (full-text article views including HTML views, PDF and ePub downloads, according to the available data) and Abstracts Views on Vision4Press platform.
Data correspond to usage on the plateform after 2015. The current usage metrics is available 48-96 hours after online publication and is updated daily on week days.
Initial download of the metrics may take a while.