Fig. 9
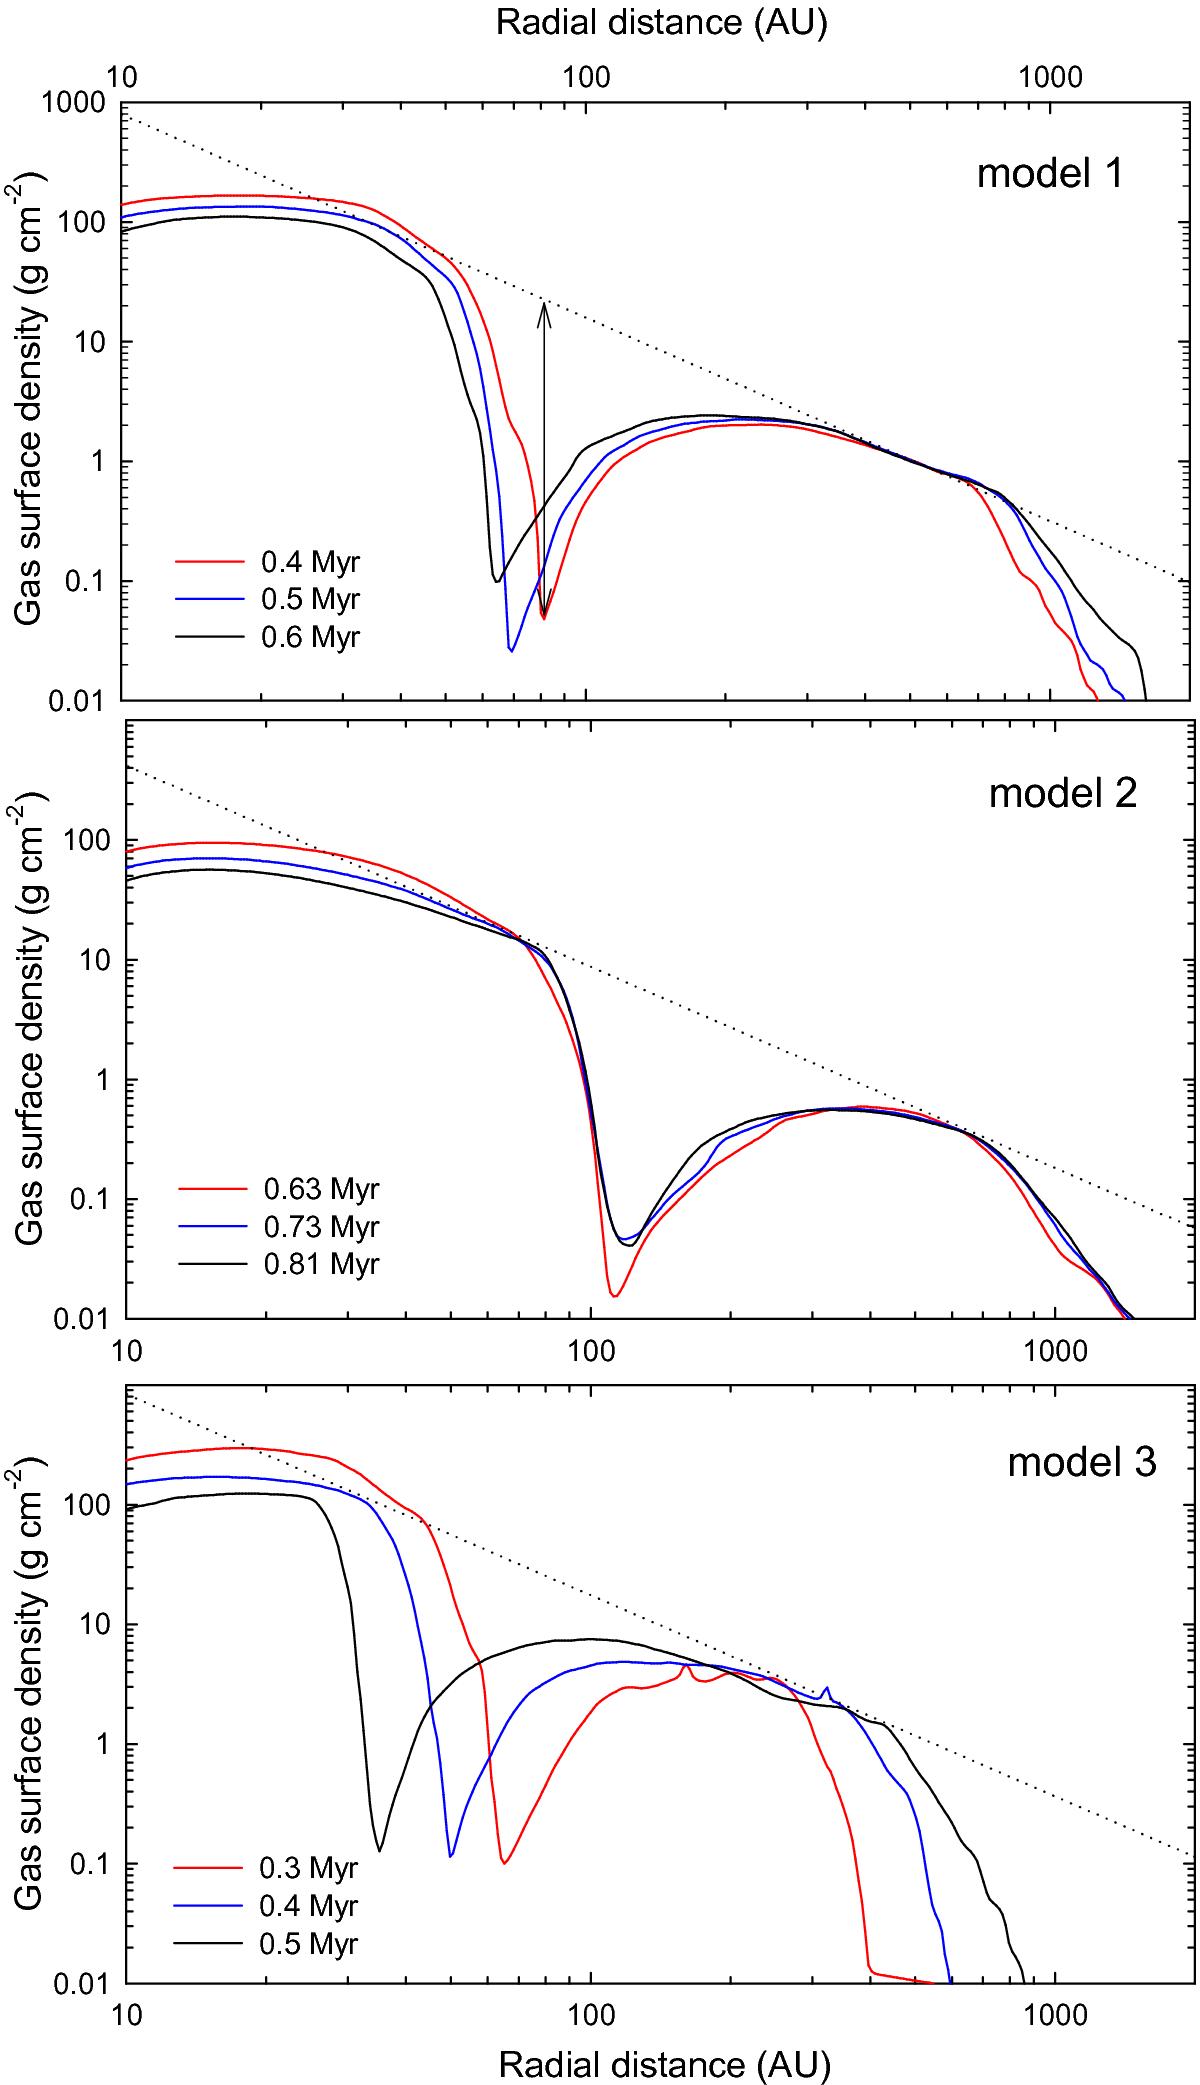
Azimuthally averaged profiles of the gas surface density in models 1, 2, and 3 (from top to bottom). Only late evolution times, when the gap has fully developed, are shown. The dotted tangent lines connect the radial density profiles in inner and outer disks. The arrow illustrates the contrast in the gas surface density in the gap at t = 0.3 Myr. The time is counted from the formation of the central star.
Current usage metrics show cumulative count of Article Views (full-text article views including HTML views, PDF and ePub downloads, according to the available data) and Abstracts Views on Vision4Press platform.
Data correspond to usage on the plateform after 2015. The current usage metrics is available 48-96 hours after online publication and is updated daily on week days.
Initial download of the metrics may take a while.