Fig. 10
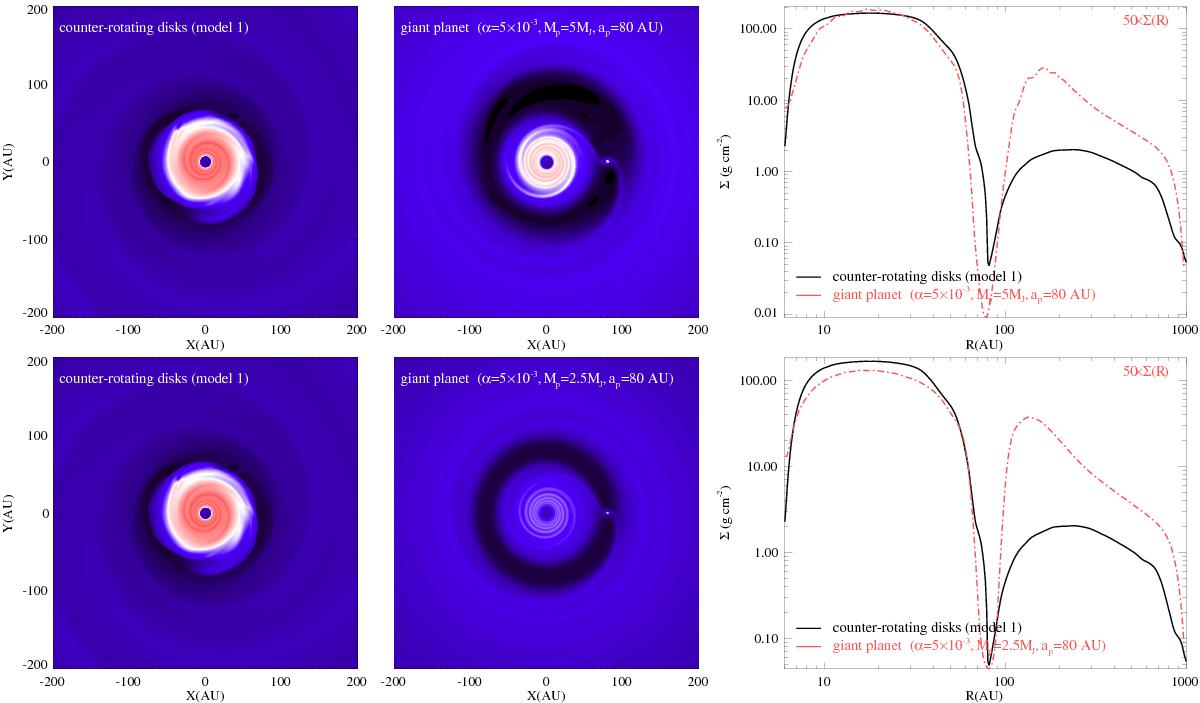
Comparison of gap formation in counter-rotating disks and a giant plant bearing protoplanetary disk assuming 5 MJup (upper row) and 2.5 MJup (lower row) planetary mass, respectively. Left panel: density distribution in the counter-rotating disk models at 0.6 Myr. Middle panel: density distribution in giant planet bearing disk model after 1000 orbits of the giant planet. Right panel: comparison of azimuthally averaged density profiles for both models. The density is scaled up by 50 in planet-bearing disk model to match the density profiles in the inner disk.
Current usage metrics show cumulative count of Article Views (full-text article views including HTML views, PDF and ePub downloads, according to the available data) and Abstracts Views on Vision4Press platform.
Data correspond to usage on the plateform after 2015. The current usage metrics is available 48-96 hours after online publication and is updated daily on week days.
Initial download of the metrics may take a while.