Fig. 8
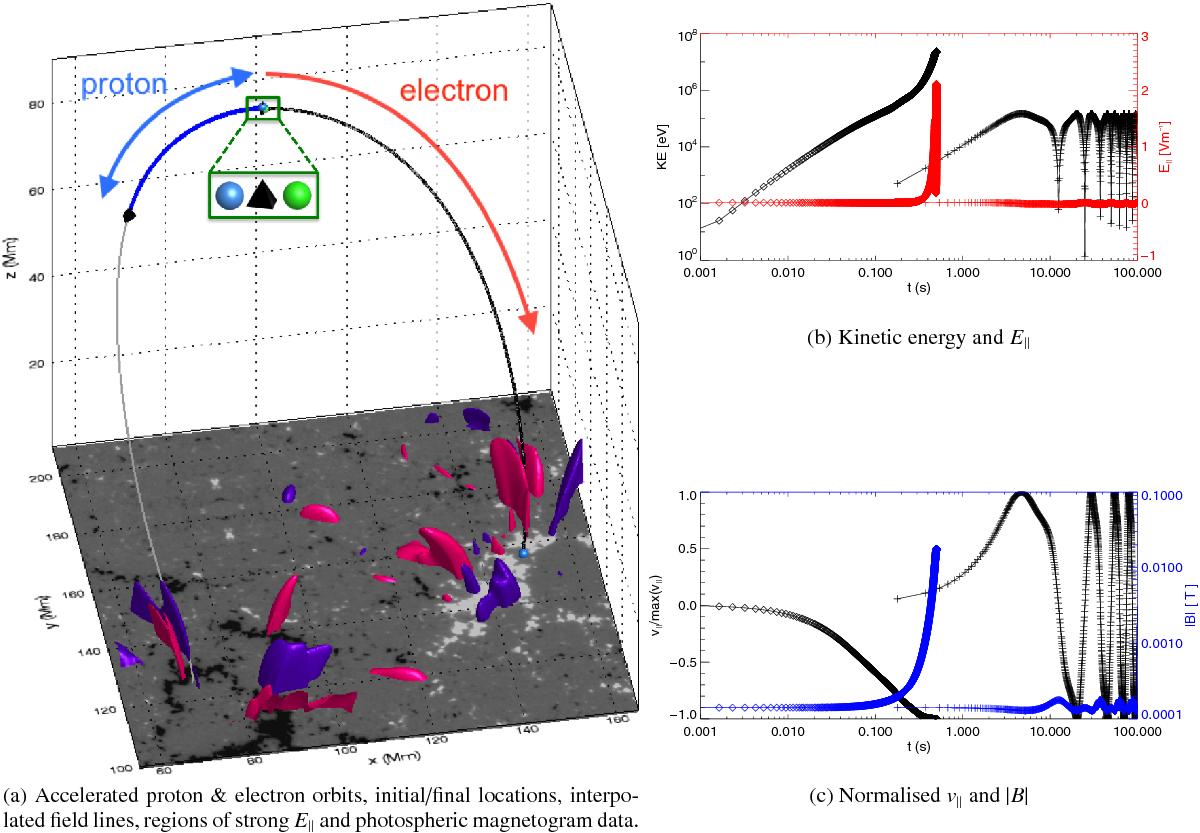
Position C: example of strong proton and electron acceleration. a) displays a zoomed view of the proton (blue) and electron (black) orbits, which both begin at the location shown by a green orb, ending at a location(s) shown by a blue orb, and with changes in sign of v|| indicated by black trapezoids (noting that, on this scale, several symbols occur close together; these symbols are shown in the dark green box). The thin grey lines indicate locally interpolated B-field lines based on the initial position (which, for the most part, closely match orbit paths), while contours of strong positive/negative E||, and the photospheric magnetogram of vertical magnetic field strength are included for context (see Fig. 2). Orbit properties for the electron and proton are displayed in b) and c) as diamonds (electron) and plus-signs (proton); b) shows the change in kinetic energy (KE) and parallel electric field component (E||) as a function of time, while c) shows the normalised parallel velocity (v||/ max(v||)) and magnetic field strength (| B |) for each orbit.
Current usage metrics show cumulative count of Article Views (full-text article views including HTML views, PDF and ePub downloads, according to the available data) and Abstracts Views on Vision4Press platform.
Data correspond to usage on the plateform after 2015. The current usage metrics is available 48-96 hours after online publication and is updated daily on week days.
Initial download of the metrics may take a while.