Fig. 7
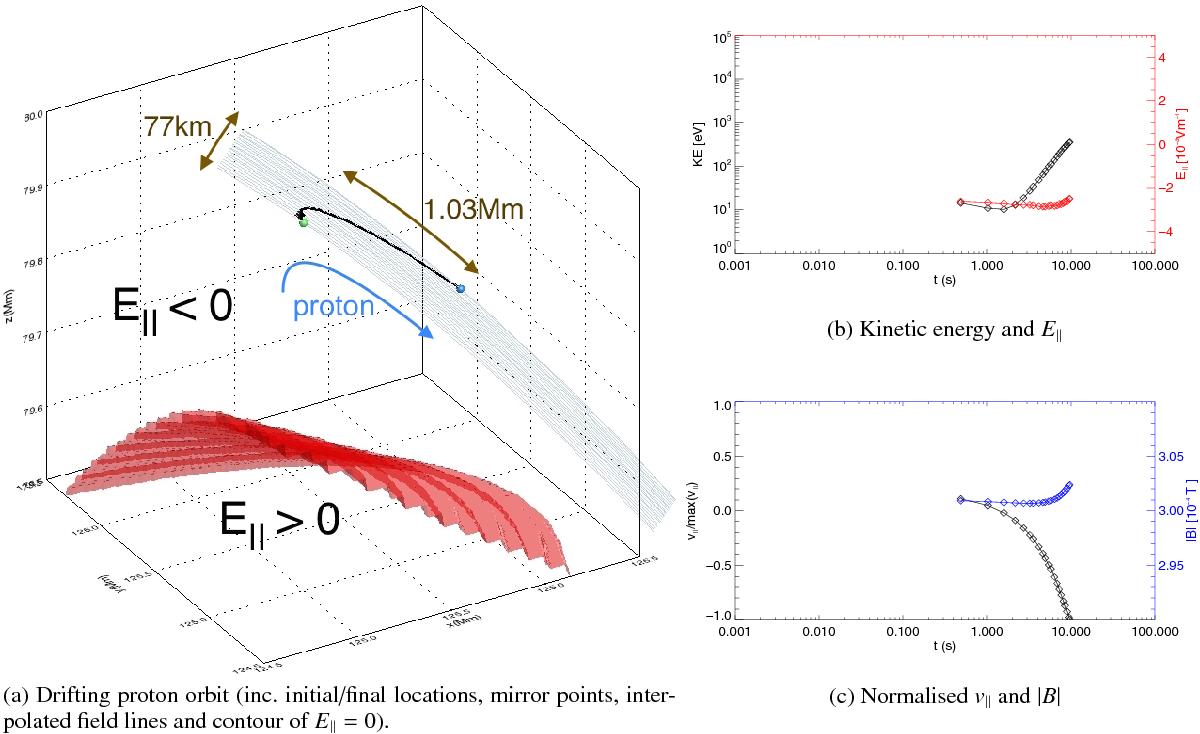
Position B: example of proton which exhibits a slow guiding centre drift. a) displays a zoomed view of the proton orbit (black), which begins at the location shown by a green orb, and ends at the location shown by a blue orb, with black trapezoids indicating the location of a change in sign of parallel velocity. The thin grey lines indicate locally interpolated B-field lines based on several orbit positions. The red isosurface denotes where the parallel electric field changes sign (E|| = 0). Orbit properties for this proton are displayed in a) and c); b) shows the change in kinetic energy (KE) and parallel electric field component (E||) as a function of time, while c) shows the normalised parallel velocity (v||/ max(v||)) and magnetic field strength (| B |) for this orbit.
Current usage metrics show cumulative count of Article Views (full-text article views including HTML views, PDF and ePub downloads, according to the available data) and Abstracts Views on Vision4Press platform.
Data correspond to usage on the plateform after 2015. The current usage metrics is available 48-96 hours after online publication and is updated daily on week days.
Initial download of the metrics may take a while.