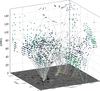
Fig. 4
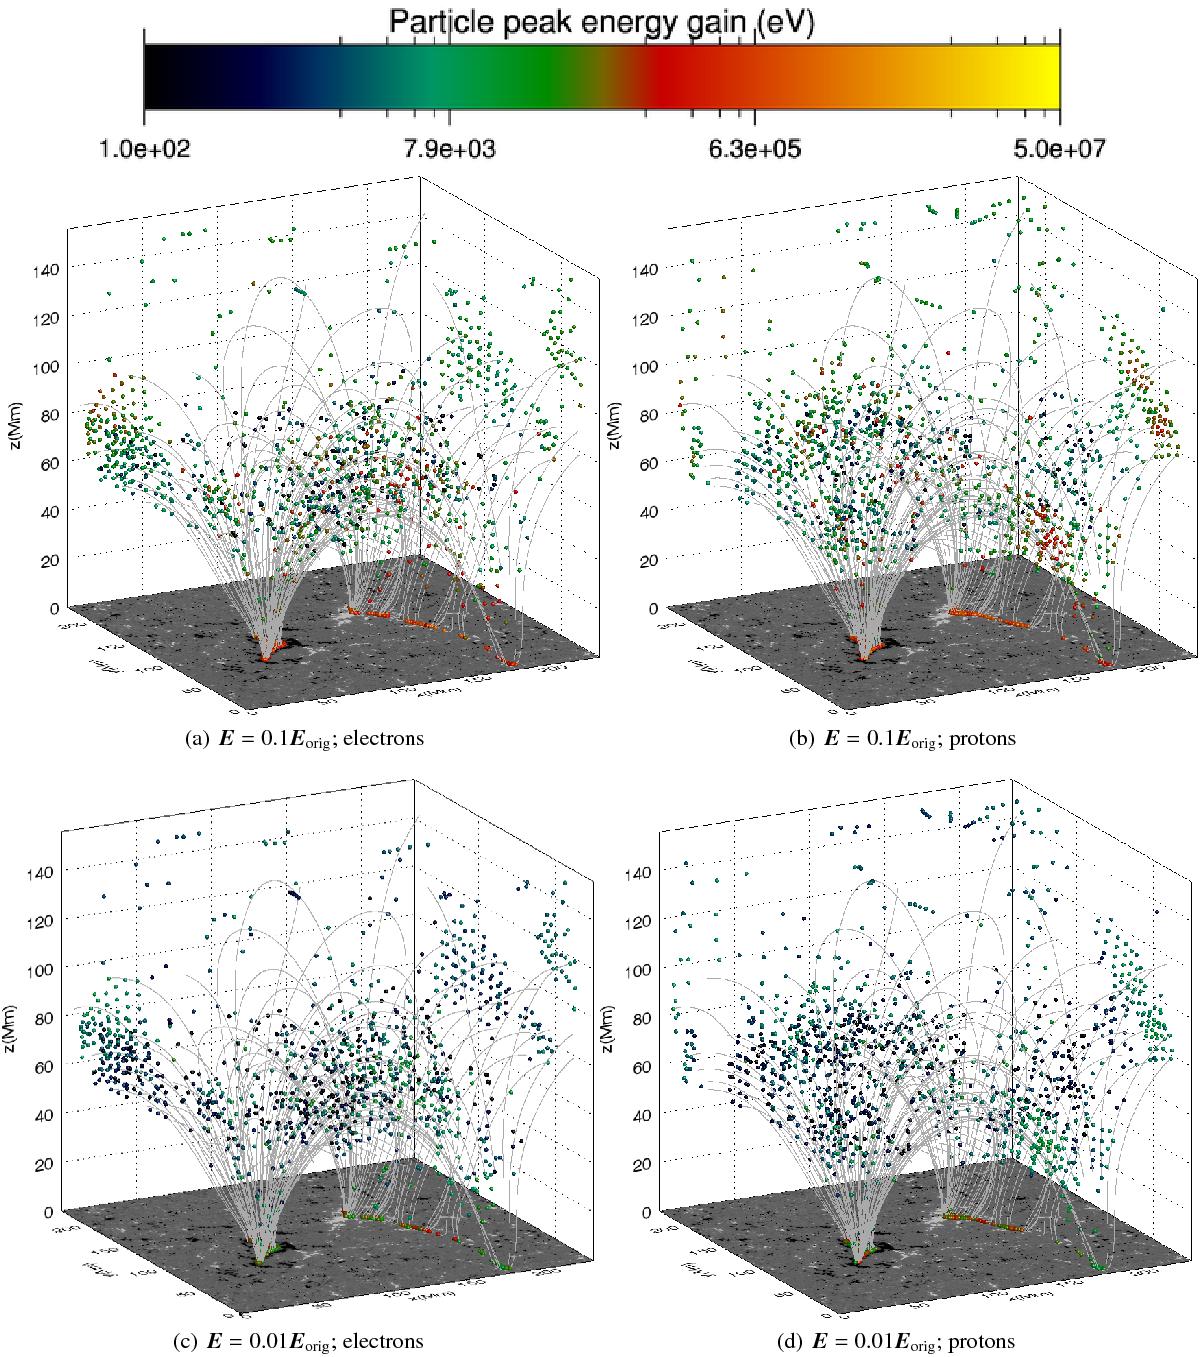
Surveys of electron and proton orbits, for initial position grid seen in Fig. 2a, subject to electric field reductions of a factor 10 (a)−b)) and 100 (c)−d)) from the original electric field (Eorig) determined by the MHD active region simulations. Final particle positions are colour-coded by peak energy (using the same colour bar as in Fig. 3 to enable direct comparisons) achieved during the orbit calculation lasting 10 s for electrons or 1000s for protons (or upon leaving the MHD simulation domain) with interpolated magnetic field lines (thin grey lines) included for reference.
Current usage metrics show cumulative count of Article Views (full-text article views including HTML views, PDF and ePub downloads, according to the available data) and Abstracts Views on Vision4Press platform.
Data correspond to usage on the plateform after 2015. The current usage metrics is available 48-96 hours after online publication and is updated daily on week days.
Initial download of the metrics may take a while.