Fig. 2
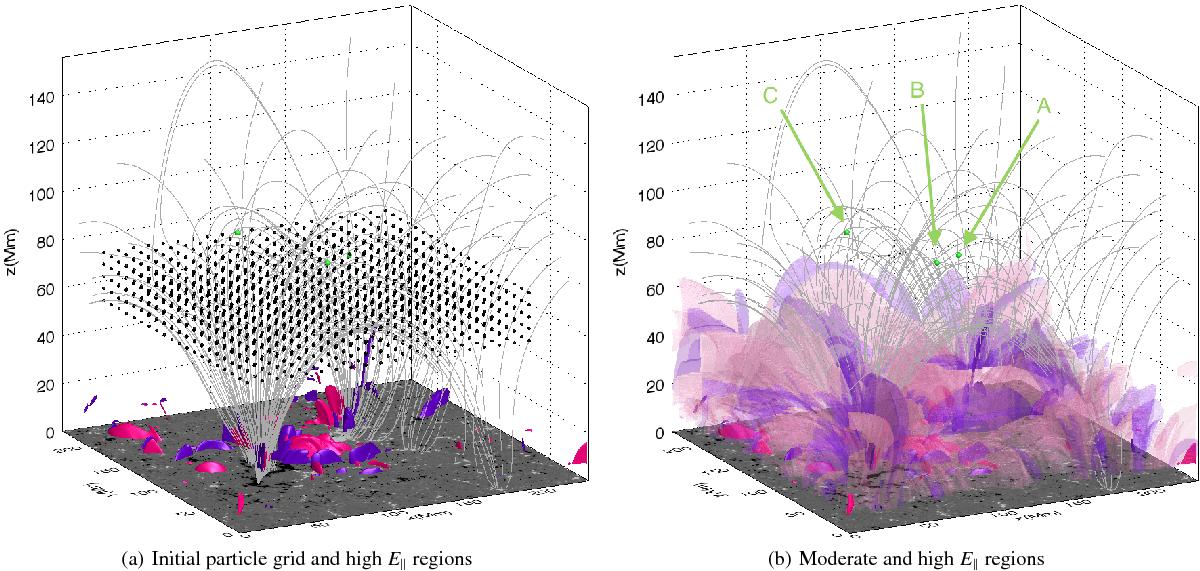
Illustration of initial particle grid and electromagnetic environment in our study. a) shows the grid of initial particle positions (shown as black orbs) located in the coronal region of MHD simulations of a stable AR (Bourdin et al. 2013). Both a) and b) show interpolated magnetic field lines (grey lines) and observed magnetogram at the base of the simulations, and isosurfaces of parallel electric field E||; a) shows opaque pink and purple surfaces of positive and negative E|| respectively, encompassing regions of current at 25% of the peak value of E|| in the corona, while b) also includes transparent surfaces of E|| at 1% of the coronal peak value (~3.5 V m-1). For reference, three green orbs labelled “A”, “B” and “C” indicate the initial positions of orbits studied in detail in Sect. 4.
Current usage metrics show cumulative count of Article Views (full-text article views including HTML views, PDF and ePub downloads, according to the available data) and Abstracts Views on Vision4Press platform.
Data correspond to usage on the plateform after 2015. The current usage metrics is available 48-96 hours after online publication and is updated daily on week days.
Initial download of the metrics may take a while.