| Issue |
A&A
Volume 586, February 2016
|
|
|---|---|---|
| Article Number | A51 | |
| Number of page(s) | 9 | |
| Section | Galactic structure, stellar clusters and populations | |
| DOI | https://doi.org/10.1051/0004-6361/201527686 | |
| Published online | 26 January 2016 | |
GeMS MCAO observations of the Galactic globular cluster NGC 2808: the absolute age⋆
1
INAF–Osservatorio Astronomico di Bologna, via Ranzani 1,
40127
Bologna,
Italy
e-mail:
This email address is being protected from spambots. You need JavaScript enabled to view it.
2
University of Groningen, Kapteyn Astronomical
Institute, 9747
AD
Groningen, The
Netherlands
3
Herzberg Astronomy and Astrophysics, National Research Council
Canada, 5071 West Saanich Road, Victoria, BC
V9E 2E7,
Canada
4
Dipartimento di Fisica, Università di Roma Tor
Vergata, via della Ricerca
Scientifca 1, 00133
Roma,
Italy
5
INAF–Osservatorio Astronomico di Roma, via Frascati
33, 00040
Monteporzio Catone,
Italy
6
INAF–Osservatorio Astronomico di Capodimonte, via Moiariello
16, 80131
Napoli,
Italy
7
Department of Physics and Astronomy, University of
Victoria, 3800 Finnerty Road,
Victoria, BC
V8P 5C2,
Canada
Received: 3 November 2015
Accepted: 9 December 2015
Abstract
Context. Globular clusters are the oldest stellar systems in the Milky Way, and they probe the early epoch of the Galaxy formation. However, the uncertainties on their absolute age are still too large to soundly constrain how the Galactic structures have assembled.
Aims. The aim of this work is to obtain an accurate estimate of the absolute age of the globular cluster NGC 2808 using deep IR data obtained with the multi-conjugate adaptive optics system operating at the Gemini South telescope (GeMS).
Methods. This exquisite photometry, combined with that obtained in V and I-bands with HST, allowed us to detect the faint Main Sequence Knee feature in NGC 2808 colour magnitude diagram. The difference between this point and the main sequence turn-off is a good age estimator that provides ages with unprecedented accuracy.
Results. We find that NGC 2808 has an age of t = 10.9 ± 0.7 (intrinsic) ±0.45 (metallicity term) Gyr. A possible contamination by He-enhanced population could make the cluster up to 0.25 Gyr older. Although this age estimate agrees with the age coming from the classical turn-off method (t = 11.0 Gyr), its uncertainty is a factor ~3 better, since it avoids systematics in reddening, distance assumptions, and photometric zero point determination. The final absolute age indicates that NGC 2808 is slightly younger than other Galactic globular clusters with similar metallicity.
Key words: globular clusters: individual: NGC 2808 / instrumentation: adaptive optics / techniques: photometric
Tables of the photometry are only available at the CDS via anonymous ftp to cdsarc.u-strasbg.fr (130.79.128.5) or via http://cdsarc.u-strasbg.fr/viz-bin/qcat?J/A+A/586/A51
© ESO, 2016
1. Introduction
The future advent of extremely large telescopes (ELTs), such as the Giant Magellan Telescope (GMT, see e.g. Thomas-Osip et al. 2010), the Thirty Meter Telescope (TMT, Sanders 2013) and the European-Extremely Large Telescope (E-ELT, Gilmozzi & Spyromilio 2008), is putting near-infrared (NIR, 0.8–2.2μm) astronomy on the cutting edge of the next scientific revolution. With diameters of their primary mirrors at least a factor of three larger than the current biggest telescopes, distant and unexplored regions of the universe will be reached for the first time. At the same time, the potentially superb spatial resolution will allow us to resolve extremely dense regions such as the centre of our Galaxy and to study the astrometry of celestial bodies with unprecedented accuracy. However, to fully exploit this potential, diffraction-limited observations have to be achieved, and this requires the successful use and development of adaptive optics (AO) techniques.
Up to now, the best AO-performance in terms of stability of the AO-correction over a wide field of view (FoV) is reached by multi-conjugate AO (MCAO) systems such as the Multi-Conjugate Adaptive Optics Demonstrator MAD (Marchetti et al. 2007) at the Very Large Telescope (see e.g. the works by Ferraro et al. 2009; Bono et al. 2010; Fiorentino et al. 2011) or the Gemini Multi-Conjugate Adaptive Optics System (GeMS, see e.g. Neichel et al. 2014b,a; Davidge 2014; Saracino et al. 2015; Turri et al. 2015) facility. The latter is currently the only operating MCAO facility.
GeMS uses three natural guide stars (NGS) and five sodium laser guide stars (LGS) to correct for the distortions in the wave front by the thermally turbulent atmosphere. A similar combination of LGS+NGS is planned for the E-ELT MCAO facility MAORY (Multi-conjugate Adaptive Optics RelaY for the E-ELT, Diolaiti 2010). Therefore, investigating current GeMS performance and exploiting its data provide us a unique opportunity to learn how to take full advantage of the future ELT potential.
Ideal scientific targets for studying the MCAO performance are stellar fields ensuring a large number of point-like sources uniformly distributed across the field of view, e.g. Galactic globular clusters (GCs). Our group have selected a sample of GCs and observed them with GeMS with the aim of studying their NIR properties and kinematics and of understanding the performance of an MCAO system using science-based metrics, with an eye towards future science programmes with the ELTs. First results from this programme are presented in Turri et al. (2015). One of the most interesting GCs is the southern GC NGC 2808, since it is one of the most peculiar stellar systems in the Galaxy. With a mass of ~106M⊙ (McLaughlin & van der Marel 2005), it is one of the most massive known GCs. Its colour magnitude diagrams (CMDs) reveal several peculiar features. D’Antona et al. (2005) first discovered that the main sequence (MS) of the cluster has a blueward extension that is not compatible with a single stellar population.
By using the Hubble Space Telescope Advanced Camera for Survey (HST/ACS), Piotto et al. (2007) discovered that the MS of the cluster shows a complex structure with the presence of three separated sequences. Such complexity has increased more now, since Milone et al. (2015) found the presence of at least five different MSs and red giant branches (RGBs) by using a combination of ultraviolet (UV) HST filters. Bellini et al. (2015) discovered that two out of these five populations have a radially anisotropic velocity distribution. All these findings, together with the investigation of other CMD sequences like the peculiar horizontal branch (HB, see Bedin et al. 2000; Dalessandro et al. 2011; Milone et al. 2014) or the RGB bump (Nataf et al. 2013) further support the hypothesis that multiple stellar generations in NGC 2808 are enriched in helium by at least ΔY = 0.13. This evidence has been confirmed spectroscopically by the work of Bragaglia et al. (2010) and from the direct measurement of the He coronal line at 10 830 Å by Pasquini et al. (2011), thus demonstrating that NGC 2808 shows one of the most extreme Y-enhancements observed amongst all the Galactic GCs. Moreover, the complexity of the system in terms of five multiple populations has been confirmed spectroscopically by the recent work of Carretta (2015), who also demonstrated its homogeneity in iron content.
Another peculiarity of NGC 2808 is its age. According to several works such as Marín-Franch et al. (2009) or VandenBerg et al. (2013), this cluster is substantially (10–20%) younger than the average age of the GCs with similar metallicity of ~11 Gyr old. However, such a claim does not completely agree in the literature, since De Angeli et al. (2005), estimated a younger age of 8.4 Gyr using the difference in magnitude between the MS-turn off (MSTO) and the zero-age HB (ZAHB), while Piotto et al. (2007) found their CMD to be best fitted by a 12.5 Gyr old theoretical model. By exploiting deep IR MAD observations, Bono et al. (2010) defined a new method of measuring the absolute age of stellar clusters that is more precise than the previous ones by at least a factor of two. This method is based on the magnitude difference  between the MSTO and the faint MS-knee (MSK), a feature that arises in the IR CMD as an opacity effect driven by the collisionally induced absorption (CIA) of molecular hydrogen (Saumon et al. 1994; Borysow et al. 2001) in the surface of cool dwarfs. Such a feature has also been observed in optical bands by Di Cecco et al. (2015) in the cluster M71, thus confirming the prediction of Borysow et al. (1997). MCAO IR observations are ideal for probing the faint GC-MS, and in this paper we exploit GeMS observations of NGC 2808 to provide an accurate age measurement using this newly developed method.
The paper is organised as follows. In Sect. 2 we present our dataset and the details of the data reduction. In Sect. 3 the output of the reduction in terms of observed CMD are shown. In Sect. 4 we describe the result of our analysis, and we finally draw our conclusion in Sect. 5.
2. Photometric dataset and data reduction
This work is part of a project using Gemini-S (Programme IDs: GS-2012B-SV-406, GS-2013A-Q-16, GS-2013B-Q-55, PI: McConnachie) to study the NIR photometric properties of Galactic GCs through the exploitation of the GeMS facility. GeMS assists the Gemini South Adaptive Optics Imager (GSAOI) IR Camera, which is equipped with a 2 × 2 mosaic of Rockwell HAWAII-2RG 2048 × 2048 pixel array and covers a total FoV of 85′′× 85′′ with a spatial resolution of 0.02′′ pixel-1 (Neichel et al. 2014b). This MCAO system uses three NGS and a constellation of five laser guide stars to correct for the distortions introduced by the turbulent atmosphere of the Earth.
The dataset we analysed samples NGC 2808 central regions in the J and Ks-filters, through a series of eight dithered exposures per filter, each with an exposure time of 160 s. To overcome saturation of the brightest stars in these deep images, we also used two 90 second-long and two 21 second-long short exposures per filter (see Table 1).
GeMS photometric dataset.
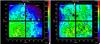 |
Fig. 1 FWHM map for stars measured in one of the Ks-band (left panel) and J-band (right panel) images. The former was taken on 19 April 2013, the latter on 23 May 2103. Chips are numbered counter-clockwise starting from the lower right chip 1 (see white labels). The white squares indicate the location of the three natural guide stars. Iso-FWHM contours are also overplotted as thick black lines. |
The pre-reduction of each raw image was performed by means of the standard IRAF1 tools. The master flat field was built by combining dome flat fields (which have high signal-to-noise ratio) and twilight flat fields (which have a uniform illumination). We retrieved 20 dome flat fields taken with projector lamps turned off (OFF), 20 taken with lamps turned on (ON), and 20 twilight flat fields (TWI). We computed the 3σ-clipped median frame for each of the three and defined the final master flat (FL) as FL=(ONmed–OFFmed) ×R, where R is the ratio between the normalised TWImed and (ONmed–OFFmed), which is smoothed further with a median filter to suppress the pixel-to-pixel statistics and leave only a term that describes the illumination pattern of the sky. In this way the master flat has the pixel-to-pixel statistics of the dome flats and the illumination pattern of the sky flats. We did not need to apply dark frames because of the very low dark current of the H2RG detectors.
Unfortunately, the observing conditions were not very good. As summarised in Table 1, the mean seeing2 during the first night (19 April 2013) was ~0.6′′, and only two short and six long exposures in the Ks-band were taken. During the subsequent two nights when the observations were completed (20 April and 23 May 2013), the seeing always exceeded 1.1′′. The left-hand panel of Fig. 1 shows the AO-corrected full-width-at-half-maximum (FWHM) variation across the GeMS FoV for one of the K-band images. Chips are numbered from one to four starting from the lower right chip, moving clockwise. From this map it is evident that the better and more stable correction has been achieved in the lower left chip number 2, but that outside the triangle defined by the location of the NGS, the AO-correction is not as effective. Across the entire FoV, the K-band FWHM varies from 0.07′′ to 0.15′′ (diffraction limit is ~0.06′′), which is a total variation of about the 50%, and this is a worse performance than found, for instance, by Neichel et al. (2014a) and Saracino et al. (2015). In this sense it is worth mentioning that one of the NGS (located in the northern region of the image) is considerably fainter (R ≃ 14.4 mag) than the other two, being about one magnitude less luminous in the R-band. Such an asymmetry might be responsible for the worse photometric performance obtained for the two upper chips.
The right-hand panel of Fig. 1 shows the same map for one of the J-band images. The combination of intrinsically less efficient AO correction at these shorter wavelengths and the poor seeing conditions means the situation is even worse. Here the FWHM varies from ~0.07′′ in a small region of chip 2 to ~0.24′′ on the left side of chip 3 with a typical value across the entire FoV of ~0.15′′ (diffraction limit is ~0.04′′). As we show in Sect. 3, this strongly affects the depth achieved by our IR photometry.
The reduction of the scientific images was performed by means of the DAOPHOT suite of software (Stetson 1987, 1994). The chips of each image have been treated separately. The PSF for each frame was modelled with great care by selecting ~100–200 bright and isolated stars uniformly distributed across the FoV and by fitting their brightness profile with an analytic function plus a look-up table of the residuals that have been allowed to vary spatially as a cubic function. The best-fit model has then been applied to all the sources detected above a 3σ threshold from the local background by using ALLSTAR. To improve both the astrometry and the photometry on each single image, we then created a master list of stars for each filter and chip, which is composed of all the sources detected in at least one image, and provided it as input for ALLFRAME. The output files were combined with DAOMASTER and four single-chip catalogues with J and K instrumental magnitudes were built by selecting only stars detected in at least 4 (2 K-band and 2 J-band) images and averaging their position and magnitudes measurements.
Each catalogue was then calibrated onto the Two Micron All Sky Survey (2MASS) photometric scale by means of an intermediate catalogue of calibrated stars obtained through analysing 25 High Acuity Wide field K-band Imager (HAWK-I, see Kissler-Patig et al. 2008) exposures of the same cluster in the J and K-filters. The reduction of these images followed the same steps as described before. By cross-matching our HAWK-I catalogue with the 2MASS catalogue, we found 495 stars in common and used them as calibrators. The final calibrated HAWK-I (K,J − K) colour magnitude diagram (CMD) is shown in the left-hand panel of Fig. 2, together with the relations used to calibrate HAWK-I instrumental magnitudes.
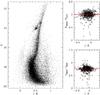 |
Fig. 2 Left panel: K,J − K CMD of NGC 2808 from HAWK-I images. Instrumental magnitudes were calibrated onto the 2MASS reference system by using the relations shown in the right panels, using 495 stars in common between the two catalogues. |
We were able to exploit the HAWK-I spatial resolution to find about 1200 stars in common with each single-chip GeMS catalogue. We used these stars for the absolute photometric calibration by applying the zero points shown in Fig. 3, computed according to a 3σ-clipping iterative procedure in a range of magnitude suitably chosen to exclude faint stars and sources that reached non-linearity in the long exposures. (Stars surviving this selection are plotted as red circles in Fig. 3.) We chose to apply constant zero points because when looking for the best-fitting linear relations, the slopes turned out to be zero within the uncertainties of the fit for all eight chips. Similar to what was found by Turri et al. (2015), in the K-band one of the chips appears to have an efficiency of ~0.2 mag higher than the others. Once calibrated, the four catalogues were merged together to create the final GeMS catalogue. The errors on the inter-chip calibration was computed as the sum in quadrature of the standard deviations around the mean zero point of each chip and are σcal,J = 0.02 mag and σcal,K = 0.02 mag.
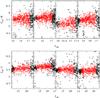 |
Fig. 3 Calibration zero points computed from the identification of stars in common between the HAWK-I and GeMS catalogues. Upper panels shows the zero points for the four chips in the Ks-band, while lower panels show the same for the J-band. Stars surviving the selection criteria are plotted as red circles. |
The calibration procedure also allowed us to verify that the adopted cubically varying PSF model describes the actual PSF variation well across GeMS FoV. In fact, by computing the zero-points in smaller sub-fields, we found that they all agree within a 1σcal uncertainty with those adopted for the calibration. The only exceptions were found for the upper right-hand corner of chip 4 and the lower right-hand corner of chip 1, where the K-band zero points differed by 2.5σcal,K and 2σcal,K, respectively. Indeed these sub-fields correspond to the regions with the largest measured FWHM (see the left panel of Fig. 1). However, as specified in the next section, these two chips will not be used for the age estimation and therefore will not affect our final results.
3. Colour–magnitude diagrams
3.1. IR CMD
The (K,J − K) CMD obtained from the final GeMS catalogue is shown in Fig. 4. Stars have been selected according to their photometric error and sharpness, as shown in the right-hand panels of the figure and their distance from the centre of the cluster (Goldsbury et al. 2010), excluding those within a radius of 30′′ to avoid the severe crowding affecting those regions.
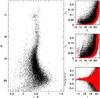 |
Fig. 4 (K,J − K) CMD of NGC 2808 from our GeMS photometry. Stars shown in the CMD have been selected according to their photometric errors and sharpness (red dots in the right panels) and including only sources located farther than 30′′ from the cluster centre. |
The CMD shows the evolutionary sequences from the MS to the RGB, where the short exposures reach non-linearity (at K ~ 14.5) and then saturate before the RGB tip. Moving towards fainter stars, the CMD reaches several magnitudes below the MSTO, but it is not deep enough to reach the MS knee. The not ideal observing conditions might have affected the depth of our photometry, especially in the J-band. To quantify how the completeness of our photometry has suffered from this effect, we cross-matched our GeMS catalogue with the optical HST photometry coming from the ACS survey of Galactic GCs (Sarajedini et al. 2007). The comparison between the number of stars detected in the two catalogues in different bins of magnitude gives their relative completeness. Figure 5 shows such a relative completeness for each chip of GeMS as a function of the observed GeMS K-magnitude from the lower RGB to the faint MS. The K-magnitude in the X-axis has been obtained from the ACS V-magnitudes using the (K,V − K) ridge-line for the conversion. The trends for the relative completeness of the GeMS K-band photometry are shown, along with GeMS J-band photometry. As expected V-band ACS deep photometry has a larger completeness than what is reached with K- or J-band GeMS photometry. In particular, in K-band there is only one chip that maintains a relative completeness above the 50% level (i.e. chip 2, red line in Fig. 5). In J-band the relative completeness drops below 50% at much brighter magnitudes, with the best case again chip 2 at V ≃ 24. Therefore, as already observed in Turri et al. (2015), the optical-IR K,V − K CMD is expected to be much deeper, and by getting rid of the limiting effect of J-magnitudes it will reach the MS knee, allowing us to obtain an accurate estimate of the cluster age.
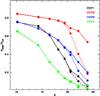 |
Fig. 5 Completeness of our GeMS photometry relative to HST from the lower RGB down to the MS. Solid lines describe the trend for the K-band, dashed lines for the J-band. Each chip is shown with a different colour, and the best performing chip in both filters turned out to be chip2. |
3.2. Optical-IR CMD
The left-hand panel of Fig. 6 shows the K,V − K CMD obtained for the stars in common between the ACS catalogue and our GeMS photometry, when cleaned for photometric errors and sharpness. The optical magnitudes are calibrated to the Johnson-Cousins system. (They correspond to the Vground and Iground of the publicly available catalogue.)
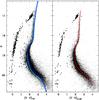 |
Fig. 6 (K,V − K) CMD of NGC 2808 obtained from the combination of our GeMS photometry and the HST/ACS catalogue of (Sarajedini et al. 2007). The left panel shows the CMD of the entire GeMS sample, fit by a theoretical model taken from (VandenBerg et al. 2012). An Y-enhanced model (Y = 0.33) is also plotted in cyan for sake of comparison. The right panel shows only stars belonging to the best chip 2 and the corresponding ridge line is superimposed in red. HB stars are highlighted with thick symbols. |
Data plotted in this figure display several interesting features worth discussing in more detail.
-
(i)
It is immediately clear that the limiting effect of the J-band has been removed and the optical-NIR CMD is much deeper than the purely IR one, spanning from the RGB bump (K ~ 13.5 mag, see also Fig. 2) down to the lower main sequence (K ~ 21.5 mag).
-
(ii)
The current photometry covers the entire range of HB stars: from K ~ 14 mag, which is typical of red HB stars, down to K ~ 21 mag, typical of extreme HB stars. HB stars were selected from the optical CMD of the ACS catalogue (Fig. 6). Dating back to the seminal investigations by Ferraro et al. (1998) and by Castellani et al. (2006), the HB morphology of NGC 2808 has been a longstanding puzzle, since it is the so-called prototype of multi-modal HB morphology. When moving from cooler to hotter stellar structures, the cluster HB shows sizeable samples of red and blue HB stars and a very limited sample of RR Lyrae stars (Kunder et al. 2013). Its luminosity function shows two well-defined gaps and a tail of stellar structures approaching the typical range of sub-dwarf B- and sub-dwarf O stars (Castellani et al. 2007; Moehler et al. 2011; Latour et al. 2014). The comparison with the HB luminosity function of Galactic globulars showing similar extended HB morphologies has been hampered by the use of either optical or near UV colours that have limited sensitivity when moving from extreme HB (Teff = 35 000 K) to red HB (Teff = 5000 K) stars. The key advantage in using the V − K colour is that it is a solid temperature indicator for giant stars (Di Benedetto 2005), and the quoted temperature range is covered by roughly three magnitudes in V − K. Current optical-NIR photometry (see e.g. Libralato et al. 2014) are paving the way for constraining the secondary features (gaps, jumps; see Grundahl et al. 1999) of the HB luminosity function. Moreover, they also play a fundamental role in using hot HB stars as stellar tracers (Kinman et al. 2012).
-
(iii)
There is evidence that a few hot HB candidates attain, at fixed K-band magnitudes, colours that are systematically cooler (V − K = 0.2–0.3 mag) than typical extreme HB stars. Similar objects were called by Castellani et al. (2006) HB peculiar, suggesting that they might be intrinsic binary candidates. The optical-NIR colours seem to support this working hypothesis.
In the left-hand panel of Fig. 6 we show a comparison between the photometry and a theoretical model interpolated from the set of isochrones provided by VandenBerg et al. (2012), suitably selected according to the age (11 Gyr, VandenBerg et al. 2013), metal composition ([Fe/H] = −1.13 dex, [α/Fe]= + 0.3Carretta 2015) and using a standard helium content (Y = 0.25). We placed the isochrone onto the observed CMD and found that the best fit was achieved by assuming a colour excess E(B − V) = 0.17 mag and a distance modulus of m − M0 = 15.00 mag. These values agree with previous estimates available in the literature, such as Piotto et al. (2007) and Kunder et al. (2013), who found E(B − V) = 0.18 mag, m − M0 = 15.0 mag and E(B − V) = 0.17 mag, m − M0 = 15.04 mag, respectively. From such a comparison, it is immediately clear that this colour combination goes much deeper than the purely NIR, easily reaching the faint MS knee. Since its location in magnitude and colour is essentially independent of cluster age at fixed chemical composition, it was first used by Bono et al. (2010) and then in other works (Di Cecco et al. 2015; Monelli et al. 2015) to determine the absolute age of GCs with an accuracy that is typically two times better than obtained by other age indicators. In fact, the use of a relative difference between the magnitude of the MSTO and the MSK suppresses the effect that uncertainties on several parameters (such as distance and reddening, see Monelli et al. 2015 for more details) have on the accuracy of the age estimate. Moreover, the MSK is located in a region of the MS that is only marginally affected by uncertainties on the treatment of the convection in theoretical models, since these convective motions are nearly adiabatic (Saumon & Marley 2008).
For these reasons and with the aim of determining the most accurate age estimate to date for NGC 2808, we computed the mean ridge line of the K,V − K CMD following the method described in detail in Di Cecco et al. (2015) and using only the stars detected in the GeMS chip with the best AO-correction efficiency and stability (chip 2, see Fig. 1), and therefore deeper and more complete photometry (see Fig. 5). This choice allows us to avoid systematic effects introduced by the calibration procedure. The adopted method consists of a numerical algorithm that pinpoints the peaks of the iso-contours described by the K,V − K CMD to provide the ridge-line first guess. This solution is then fit with a bi-cubic spline and smoothed3. Finally, to be as accurate as possible in determining the relevant points (MSTO and MSK), we re-sampled the ridge line by steps of 0.001 mag. The CMD and ridge line are shown in the right-hand panel of Fig. 6.
4. Results
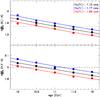 |
Fig. 7 Upper panel: theoretical relation between |

Several previous estimates of the relative age of NGC 2808 in the literature agree that this cluster has a younger age than the average of Galactic GCs with a similar metallicity. By using the so-called vertical method measuring the relative magnitude difference between the ZAHB and the MSTO, De Angeli et al. (2005) found NGC 2808 to be about the 23% younger than clusters of similar metallicity, that is ~8.4 ± 0.9 Gyr old. Following the MS-fitting method and comparing TO luminosities, Marín-Franch et al. (2009) estimated a difference of about 15%, corresponding to an age of 10.9 ± 0.4 Gyr, and classified NGC 2808 as belonging to their class of young clusters. By studying the peculiar morphology of the HB, Dotter et al. (2010) and Milone et al. (2015) similarly found a 10–15% younger relative age. Using an improved version of the vertical method, which takes constraints coming from the HST CMD fitting into account, VandenBerg et al. (2013) also estimated a younger age, and anchoring it to an absolute scale, they quoted an age for NGC 2808 of 11.0 ± 0.4 Gyr. All these relative age measurements have small associated uncertainties, but we underline that when translating them to absolute ages, an additional term of 1–2 Gyr due to uncertainties in reddening, distance, and photometric zero points must be taken into account (Monelli et al. 2015). On the other hand, Piotto et al. (2007) found that the best fit of their triple MS was achieved using a 12.5 Gyr isochrone.
Given that this picture is in overall agreement, but with a few contradictory findings, our work aims to resolve the age issue by more accurately determining the absolute age for this cluster. First, we selected the theoretical models of VandenBerg et al. (2012), which fit very well the MS in the observed CMD shown in Fig. 6, and re-sampled them to the same magnitude step as that used for the ridge line. Then, we derived linear relations between the parameter and cluster age and metallicity. We built relations for all the combinations of filters with K able to reach the MSK (to minimise the possible effect of differential reddening), which are the K,V − K and the K,I − K planes. The result of this bi-parametric fit is shown as lines in Fig. 7, where the black line corresponds to the relation obtained for [Fe/H] = −1.13 dex, and the red and blue lines correspond to the fit for a difference in [Fe/H] of ±0.04, respectively (σ[ Fe / H ] = 0.04 is taken from Carretta 2015). The analytic form of the two fits, together with the uncertainties on each coefficient, are ![Mathematical equation: \begin{eqnarray} \log {\rm (age)} &=& (1.893\pm0.060)-(0.723\pm0.023)*\Delta_{\rm MSK}^{\rm MSTO} \nonumber\\ && \quad - (0.516\pm0.031)*{\rm [Fe/H]} \end{eqnarray}](/articles/aa/full_html/2016/02/aa27686-15/aa27686-15-eq79.png) (1)for the K,V − K plane and
(1)for the K,V − K plane and ![Mathematical equation: \begin{eqnarray} \log {\rm (age)} &=& (1.839\pm0.063)-(0.692\pm0.024)*\Delta_{\rm MSK}^{\rm MSTO} \nonumber\\ &&\quad - (0.442\pm0.033)*{\rm [Fe/H]} \end{eqnarray}](/articles/aa/full_html/2016/02/aa27686-15/aa27686-15-eq80.png) (2)for the K,I − K plane.
(2)for the K,I − K plane.
As a further check, we also computed the relation between the absolute K-magnitude of the MSTO (MK,MSTO) and the cluster age and metallicity. This relation will lead to a less accurate age determination, but will be used to verify whether an overall agreement between the two methods is found. The linear best fit we found is ![Mathematical equation: \begin{eqnarray} \log {\rm (age)} &=& (-0.919\pm0.051)+ (0.661\pm0.016)*M_{K,{\rm MSTO}} \nonumber\\ &&- (0.074\pm0.021)*{\rm [Fe/H]} . \end{eqnarray}](/articles/aa/full_html/2016/02/aa27686-15/aa27686-15-eq82.png) (3)As a second step, we used the best-fitting ridge lines (for the K,V − K CMD it is shown in the right panel of Fig. 6) to determine the observed and KMSTO. The former values were measured as described in detail in Di Cecco et al. (2015) and are
(3)As a second step, we used the best-fitting ridge lines (for the K,V − K CMD it is shown in the right panel of Fig. 6) to determine the observed and KMSTO. The former values were measured as described in detail in Di Cecco et al. (2015) and are  mag in the K,V − K plane and
  mag in the K,I − K plane (dashed horizontal lines in Fig. 7). The KMSTO value is the bluest point of the ridge line and was found to be MK,MSTO = 2.84 mag. By adopting these values in the above equations, the absolute age of NGC 2808 as measured from the difference between the magnitude of MSTO and MSK is t = 10.7 Gyr for the K,V − K case and t = 11.1 Gyr for K,I − K. The careful estimate of the overall uncertainties is addressed in the following section. As a sanity check, we also computed the absolute age as measured from the magnitude of the MSTO. The value of t = 11.0 Gyr is in good agreement with the previous findings. The good fit provided by the 11 Gyr old isochrone already described in Fig. 6 is further proof of the validity of all our measurements.
4.1. Age uncertainties
To accurately compute uncertainties on the absolute ages, we have to carefully consider the possible sources of errors affecting both the photometry and the comparison with the theoretical models. We start with the uncertainties affecting the position of both the MSK and the MSTO.
-
(i)
MSK and MSTO determination: the MSK is defined as the pointwith the minimum curvature of the low MS ridge line. To computethe curvature parameter, we took each point of the ridge line andlooked for the circumference that connects it with the two pointsof the ridge line located at ±0.5 mag. The circumference with the largest radius (i.e. the minimum curvature) defines the MSK. The source of uncertainty introduced by this method is related to the size of the magnitude step used to select the three circumference points. To quantify it, we computed the location of the MSK again by varying this step from 0.1 mag to 0.8 mag, which is the limit at which the algorithm is still able to detect the MSK, since for larger steps it ceases to find the three points before reaching the MSK itself. Within this interval, the magnitude of the MSK varies by ±0.013 mag. We therefore adopted this value as the MSK determination uncertainty. On the other hand, the MSTO is defined as the bluest point of the ridge line. In this case, it turned out that the bluest colour value is shared among ten adjacent magnitude samplings of the ridge line (each of 0.001 mag size). For this reason, we adopted their average value as the magnitude of the MSTO, and we assume ±0.005 mag as the uncertainty on its determination.
-
(ii)
Photometric uncertainty: at the level of the TO, the average uncertainties for the stars in our final catalogue are of the order of 0.008 mag, while at the faint MSK this increases to 0.035 mag. The sum in quadrature gives a total internal error on
of 0.036 mag. We underline that this is the only contribution from the photometry to the error on . -
(iii)
Intra-chip calibration uncertainty: to avoid this term we only use the stars on the best chip of the GeMS dataset.
Now we list the uncertainties that only affect the position of the MSTO.
-
(i)
Absolute calibration uncertainty: this only affects the MSTO,and as pointed out in Sect. 2, it amounts to0.02 mag.
-
(ii)
Differential reddening: this would affect both the MSTO and MSK magnitudes if they were not homogeneously distributed across the FoV. However, the choice of the most photometrically complete chip ensures such uniformity and thus this term affects only the MSTO. The use of the K-band minimises its contribution. According to Bedin et al. (2000), NGC 2808 only suffers a small amount of differential reddening (δE(B − V) ≃ 0.02), which is when multiplied by the extinction coefficient of the K-filter (AK = 0.35, Cardelli et al. 1989) gives a tiny contribution of 0.007 mag.
-
(iii)
Distance uncertainty: Kunder et al. (2013) estimated an uncertainty on their RR Lyrae variable stars distance modulus (m − M0 = 15.04) of 0.13 mag. We adopt this value as the distance uncertainty, underlining that it only affects the MSTO.
-
(iv)
Absolute colour-excess uncertainty: the value adopted in our isochrone fitting E(B − V) = 0.17 mag is in good agreement with previous works. Bedin et al. (2000) quoted E(B − V) = 0.19 mag, which has also been used by Piotto et al. (2007) and Milone et al. (2015). Kunder et al. (2013) used E(B − V) = 0.17 mag, while Harris (1996) adopts E(B − V) = 0.22 mag. Given this overall agreement, we adopt 0.05 mag as a conservative uncertainty. Also in this case, only the MSTO is affected.
All the quoted terms contribute to the uncertainty on the age from the photometry. By summing together these contributions, we get σΔ = 0.038 mag and σMSTO = 0.145 mag. This translates into age uncertainties of σt,Δ = 0.7 Gyr and σt,MSTO = 2.7 Gyr. In addition, we have to take into account the effect of metallicity and helium content.
By following the relations in the previous section, an error of σ[ Fe / H ] = 0.04 (Carretta 2015) is converted to σt,Δ = 0.45 Gyr and σt,MSTO = 0.1 Gyr. The contribution to the error budget coming from helium enhancement is not possible for us to accurately estimate since our photometry is not good enough, and the combination of filters not well suited4 to separating the populations of NGC 2808 with different Y abundances. For this reason, it is not trivial to quantify the possible effect of an Y-enhanced population on our age estimate. By using the set of theoretical models of VandenBerg et al. (2012), we found that in comparison with a standard helium model, an isochrone with Y = 0.33 (and same metallicity and age) is 0.17 mag fainter for MK,MSTO and 0.24 mag fainter for MK,MSK (cyan line in the left-hand panel of Fig. 6). The difference in would therefore be 0.07 mag larger. This means that any contamination from a Y-enhanced population will artificially increase , and thus we would over-estimate the age of the cluster. A Y = 0.33 population with the same parameters would appear 1.3 Gyr older. However, Piotto et al. (2007) show that the total fraction of Y-enhanced stars is ~28%. Moreover, the Y-rich populations have been found to be located primarily in the innermost region of the cluster, which we excluded to avoid the effects of crowding. Unfortunately, no quantitative determinations of the radial distribution of the multiple sequences in NGC 2808 is available in the literature. Therefore, we can only estimate the possible contamination with the limitation that it has to be smaller than 28%. If we make the conservative assumption of a 20% Y-rich contamination, then the effect would be an increase of by 0.014 mag, corresponding to 0.25 Gyr. The resulting effect on the age coming from the MSTO is of 0.05 Gyr.
Therefore, our final age and error estimates are tΔ,KVK = 10.7 ± 0.7 (intrinsic) ± (metallicity and helium terms) Gyr,
 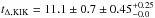 Gyr and
  Gyr. The ages determined by the method are more than twice as accurate as that coming from the MSTO method. Because there is no reason to prefer the age coming from a particular filter combination, we decided to average the two values coming from . In this way we obtain the final and most accurate absolute age obtained for NGC 2808, which is
  . This value is compared to the others available in the literature in Table 2.
We underline that this age estimate is directly comparable to all those achieved via the method in the NIR so far, since they are all based on relations built using the theoretical models of VandenBerg et al. (2012). A detailed study of the effects on the age measurements coming from the use of different set of isochrones will be presented in a forthcoming paper (Fiorentino et al., in prep.).
NGC 2808 age estimates.
5. Conclusions
In this paper, we presented the most accurate determination of the absolute age of the Galactic GC NGC 2808 using the MSK method described by Bono et al. (2010). To reach such a faint feature of the CMD, we analysed deep GeMS IR images and combined the photometry in the K-band with V-band magnitudes coming from HST. The resulting CMD did not allow us to clearly separate the multiple sequences as done using HST photometry in the UV (Milone et al. 2015), but for the first time provides K-band magnitudes of extreme-HB stars in GCs.
By comparing our measured difference between the magnitude of the MSTO and that of the MSK in the K,V − K and K,I − K planes with the output of the theoretical model from VandenBerg et al. (2012), we found an age of t = 10.9 Gyr. An accurate analysis of the error budget shows that the overall uncertainty due to the photometry is ±0.7 Gyr. An additional term caused by the uncertainty on the cluster metallicity is 0.45 Gyr, and another by possible contamination from Y-enhanced stars could make the cluster as much as 0.25 Gyr older.
Even considering all the sources of errors, our absolute age estimate is the most accurate one obtained for this cluster, and it agrees well with the previous studies that found NGC 2808 to be a cluster slightly younger than other clusters of similar metallicity. This analysis seems to rule out the estimate of 8.4 Gyr obtained in De Angeli et al. (2005) through the vertical method and the value of 12.5 Gyr used by Piotto et al. (2007) to fit the three sequences in their CMD.
Accurate measurements of relative ages have led to the possible discovery of a bimodal age-metallicity relation for Galactic GCs (Marín-Franch et al. 2009; Leaman et al. 2013). Such a bimodality is interpreted in terms of a different origin, where the younger clusters may have been lost by bigger systems accreted by the Milky Way, like dwarf galaxies. If this hypothesis is correct, then very accurate absolute ages, coupled with complete chemical screenings and orbit determinations, are required to be able to link these clusters to their possible progenitor. Future GCs age measurements with the method used in this work will provide the homogeneous set of estimates required to address this standing problem.
IRAF is distributed by the National Optical Astronomy Observatory, which is operated by the Association of Universities for Research in Astronomy, Inc., under cooperative agreement with the National Science Foundation.
Seeing values are taken from the Cerro Pachon seeing monitor (DIMM). We are aware that the DIMM usually gives higher values than the true seeing measured on scientific images (see e.g. Fiorentino et al. 2011). However, it is the only proxy we can use to quantitatively describe the quality of the weather.
A graphic representation of these steps is presented in Fig. 2 of Di Cecco et al. (2015).
UV filters are much more efficient at enhancing the effect of different chemical composition on the photometry of GC multiple generations, see e.g. Milone et al. (2015).
Acknowledgments
We thank the anonymous referee for suggestions that helped us to significantly improve the presentation of our results. Based on observations obtained at the Gemini Observatory. Acquired through the Gemini Science Archive and processed using the Gemini IRAF package. This publication makes use of data products from the Two Micron All Sky Survey, which is a joint project of the University of Massachusetts and the Infrared Processing and Analysis Center-California Institute of Technology, funded by the National Aeronautics and Space Administration and the National Science Foundation. G.F. and D.M. has been supported by the FIRB 2013 (MIUR grant RBFR13J716).
References
- Bedin, L. R., Piotto, G., Zoccali, M., et al. 2000, A&A, 363, 159 [NASA ADS] [Google Scholar]
- Bellini, A., Vesperini, E., Piotto, G., et al. 2015, ApJ, 810, L13 [NASA ADS] [CrossRef] [Google Scholar]
- Bono, G., Stetson, P. B., VandenBerg, D. A., et al. 2010, ApJ, 708, L74 [CrossRef] [Google Scholar]
- Borysow, A., Jorgensen, U. G., & Zheng, C. 1997, A&A, 324, 185 [NASA ADS] [Google Scholar]
- Borysow, A., Jorgensen, U. G., & Fu, Y. 2001, J. Quant. Spec. Radiat. Transf., 68, 235 [NASA ADS] [CrossRef] [Google Scholar]
- Bragaglia, A., Carretta, E., Gratton, R. G., et al. 2010, ApJ, 720, L41 [NASA ADS] [CrossRef] [Google Scholar]
- Cardelli, J., Clayton, G., & Mathis, J. 1989, ApJ, 345, 245 [NASA ADS] [CrossRef] [Google Scholar]
- Carretta, E. 2015, ApJ, 810, 148 [NASA ADS] [CrossRef] [Google Scholar]
- Castellani, V., Iannicola, G., Bono, G., et al. 2006, A&A, 446, 569 [NASA ADS] [CrossRef] [EDP Sciences] [Google Scholar]
- Castellani, V., Calamida, A., Bono, G., et al. 2007, ApJ, 663, 1021 [NASA ADS] [CrossRef] [Google Scholar]
- Dalessandro, E., Salaris, M., Ferraro, F. R., et al. 2011, MNRAS, 410, 694 [NASA ADS] [CrossRef] [Google Scholar]
- D’Antona, F., Bellazzini, M., Caloi, V., et al. 2005, ApJ, 631, 868 [NASA ADS] [CrossRef] [Google Scholar]
- Davidge, T. J. 2014, ApJ, 781, 95 [NASA ADS] [CrossRef] [Google Scholar]
- De Angeli, F., Piotto, G., Cassisi, S., et al. 2005, AJ, 130, 116 [NASA ADS] [CrossRef] [Google Scholar]
- Di Benedetto, G. P. 2005, MNRAS, 357, 174 [NASA ADS] [CrossRef] [Google Scholar]
- Di Cecco, A., Bono, G., Pra da Moroni, P. G., et al. 2015, AJ, 150, 51 [NASA ADS] [CrossRef] [Google Scholar]
- Diolaiti, E. 2010, The Messenger, 140, 28 [NASA ADS] [Google Scholar]
- Dotter, A., Sarajedini, A., Anderson, J., et al. 2010, ApJ, 708, 698 [NASA ADS] [CrossRef] [Google Scholar]
- Ferraro, F. R., Paltrinieri, B., Fusi Pecci, F., Rood, R. T., & Dorman, B. 1998, ApJ, 500, 311 [NASA ADS] [CrossRef] [Google Scholar]
- Ferraro, F. R., Dalessandro, E., Mucciarelli, A., et al. 2009, Nature, 462, 483 [NASA ADS] [CrossRef] [PubMed] [Google Scholar]
- Fiorentino, G., Tolstoy, E., Diolaiti, E., et al. 2011, A&A, 535, A63 [NASA ADS] [CrossRef] [EDP Sciences] [Google Scholar]
- Gilmozzi, R., & Spyromilio, J. 2008, in SPIE Conf. Ser., 7012, 19 [Google Scholar]
- Goldsbury, R., Richer, H. B., Anderson, J., et al. 2010, AJ, 140, 1830 [NASA ADS] [CrossRef] [Google Scholar]
- Grundahl, F., Catelan, M., Landsman, W. B., Stetson, P. B., & Andersen, M. I. 1999, ApJ, 524, 242 [NASA ADS] [CrossRef] [Google Scholar]
- Harris, W. E. 1996, AJ, 112, 1487 [NASA ADS] [CrossRef] [Google Scholar]
- Kinman, T. D., Cacciari, C., Bragaglia, A., Smart, R., & Spagna, A. 2012, MNRAS, 422, 2116 [NASA ADS] [CrossRef] [Google Scholar]
- Kissler-Patig, M., Pirard, J.-F., Casali, M., et al. 2008, A&A, 491, 941 [NASA ADS] [CrossRef] [EDP Sciences] [Google Scholar]
- Kunder, A., Stetson, P. B., Catelan, M., Walker, A. R., & Amigo, P. 2013, AJ, 145, 33 [NASA ADS] [CrossRef] [Google Scholar]
- Latour, M., Randall, S. K., Fontaine, G., et al. 2014, ApJ, 795, 106 [NASA ADS] [CrossRef] [Google Scholar]
- Leaman, R., VandenBerg, D. A., & Mendel, J. T. 2013, MNRAS, 436, 122 [NASA ADS] [CrossRef] [Google Scholar]
- Libralato, M., Bellini, A., Bedin, L. R., et al. 2014, A&A, 563, A80 [NASA ADS] [CrossRef] [EDP Sciences] [Google Scholar]
- Marchetti, E., Brast, R., Delabre, B., et al. 2007, The Messenger, 129, 8 [NASA ADS] [Google Scholar]
- Marín-Franch, A., Aparicio, A., Piotto, G., et al. 2009, ApJ, 694, 1498 [NASA ADS] [CrossRef] [Google Scholar]
- McLaughlin, D. E., & van der Marel, R. P. 2005, ApJS, 161, 304 [NASA ADS] [CrossRef] [Google Scholar]
- Milone, A. P., Marino, A. F., Dotter, A., et al. 2014, ApJ, 785, 21 [NASA ADS] [CrossRef] [Google Scholar]
- Milone, A. P., Marino, A. F., Piotto, G., et al. 2015, ApJ, 808, 51 [NASA ADS] [CrossRef] [Google Scholar]
- Moehler, S., Dreizler, S., Lanz, T., et al. 2011, A&A, 526, A136 [NASA ADS] [CrossRef] [EDP Sciences] [Google Scholar]
- Monelli, M., Testa, V., Bono, G., et al. 2015, ApJ, 812, 25 [NASA ADS] [CrossRef] [Google Scholar]
- Nataf, D. M., Gould, A. P., Pinsonneault, M. H., & Udalski, A. 2013, ApJ, 766, 77 [NASA ADS] [CrossRef] [Google Scholar]
- Neichel, B., Lu, J. R., Rigaut, F., et al. 2014a, MNRAS, 445, 500 [NASA ADS] [CrossRef] [Google Scholar]
- Neichel, B., Rigaut, F., Vidal, F., et al. 2014b, MNRAS, 440, 1002 [NASA ADS] [CrossRef] [Google Scholar]
- Pasquini, L., Mauas, P., Käufl, H. U., & Cacciari, C. 2011, A&A, 531, A35 [NASA ADS] [CrossRef] [EDP Sciences] [Google Scholar]
- Piotto, G., Bedin, L. R., Anderson, J., et al. 2007, ApJ, 661, L53 [NASA ADS] [CrossRef] [Google Scholar]
- Sanders, G. H. 2013, JA&A, 34, 81 [Google Scholar]
- Saracino, S., Dalessandro, E., Ferraro, F. R., et al. 2015, ApJ, 806, 152 [NASA ADS] [CrossRef] [Google Scholar]
- Sarajedini, A., Bedin, L. R., Chaboyer, B., et al. 2007, AJ, 133, 1658 [NASA ADS] [CrossRef] [Google Scholar]
- Saumon, D., & Marley, M. S. 2008, ApJ, 689, 1327 [NASA ADS] [CrossRef] [Google Scholar]
- Saumon, D., Bergeron, P., Lunine, J. I., Hubbard, W. B., & Burrows, A. 1994, ApJ, 424, 333 [NASA ADS] [CrossRef] [Google Scholar]
- Stetson, P. B. 1987, PASP, 99, 191 [NASA ADS] [CrossRef] [Google Scholar]
- Stetson, P. B. 1994, PASP, 106, 250 [NASA ADS] [CrossRef] [Google Scholar]
- Thomas-Osip, J. E., McCarthy, P., Prieto, G., Phillips, M. M., & Johns, M. 2010, in SPIE Conf. Ser., 7733, 1 [Google Scholar]
- Turri, P., McConnachie, A. W., Stetson, P. B., et al. 2015, ApJ, 811, L15 [NASA ADS] [CrossRef] [Google Scholar]
- VandenBerg, D. A., Bergbusch, P. A., Dotter, A., et al. 2012, ApJ, 755, 15 [NASA ADS] [CrossRef] [Google Scholar]
- VandenBerg, D. A., Brogaard, K., Leaman, R., & Casagrande, L. 2013, ApJ, 775, 134 [NASA ADS] [CrossRef] [Google Scholar]
All Tables
All Figures
|
Fig. 1 FWHM map for stars measured in one of the Ks-band (left panel) and J-band (right panel) images. The former was taken on 19 April 2013, the latter on 23 May 2103. Chips are numbered counter-clockwise starting from the lower right chip 1 (see white labels). The white squares indicate the location of the three natural guide stars. Iso-FWHM contours are also overplotted as thick black lines. |
| In the text | |
|
Fig. 2 Left panel: K,J − K CMD of NGC 2808 from HAWK-I images. Instrumental magnitudes were calibrated onto the 2MASS reference system by using the relations shown in the right panels, using 495 stars in common between the two catalogues. |
| In the text | |
|
Fig. 3 Calibration zero points computed from the identification of stars in common between the HAWK-I and GeMS catalogues. Upper panels shows the zero points for the four chips in the Ks-band, while lower panels show the same for the J-band. Stars surviving the selection criteria are plotted as red circles. |
| In the text | |
|
Fig. 4 (K,J − K) CMD of NGC 2808 from our GeMS photometry. Stars shown in the CMD have been selected according to their photometric errors and sharpness (red dots in the right panels) and including only sources located farther than 30′′ from the cluster centre. |
| In the text | |
|
Fig. 5 Completeness of our GeMS photometry relative to HST from the lower RGB down to the MS. Solid lines describe the trend for the K-band, dashed lines for the J-band. Each chip is shown with a different colour, and the best performing chip in both filters turned out to be chip2. |
| In the text | |
|
Fig. 6 (K,V − K) CMD of NGC 2808 obtained from the combination of our GeMS photometry and the HST/ACS catalogue of (Sarajedini et al. 2007). The left panel shows the CMD of the entire GeMS sample, fit by a theoretical model taken from (VandenBerg et al. 2012). An Y-enhanced model (Y = 0.33) is also plotted in cyan for sake of comparison. The right panel shows only stars belonging to the best chip 2 and the corresponding ridge line is superimposed in red. HB stars are highlighted with thick symbols. |
| In the text | |
|
Fig. 7 Upper panel: theoretical relation between |
| In the text | |
Current usage metrics show cumulative count of Article Views (full-text article views including HTML views, PDF and ePub downloads, according to the available data) and Abstracts Views on Vision4Press platform.
Data correspond to usage on the plateform after 2015. The current usage metrics is available 48-96 hours after online publication and is updated daily on week days.
Initial download of the metrics may take a while.