Free Access
Fig. 5
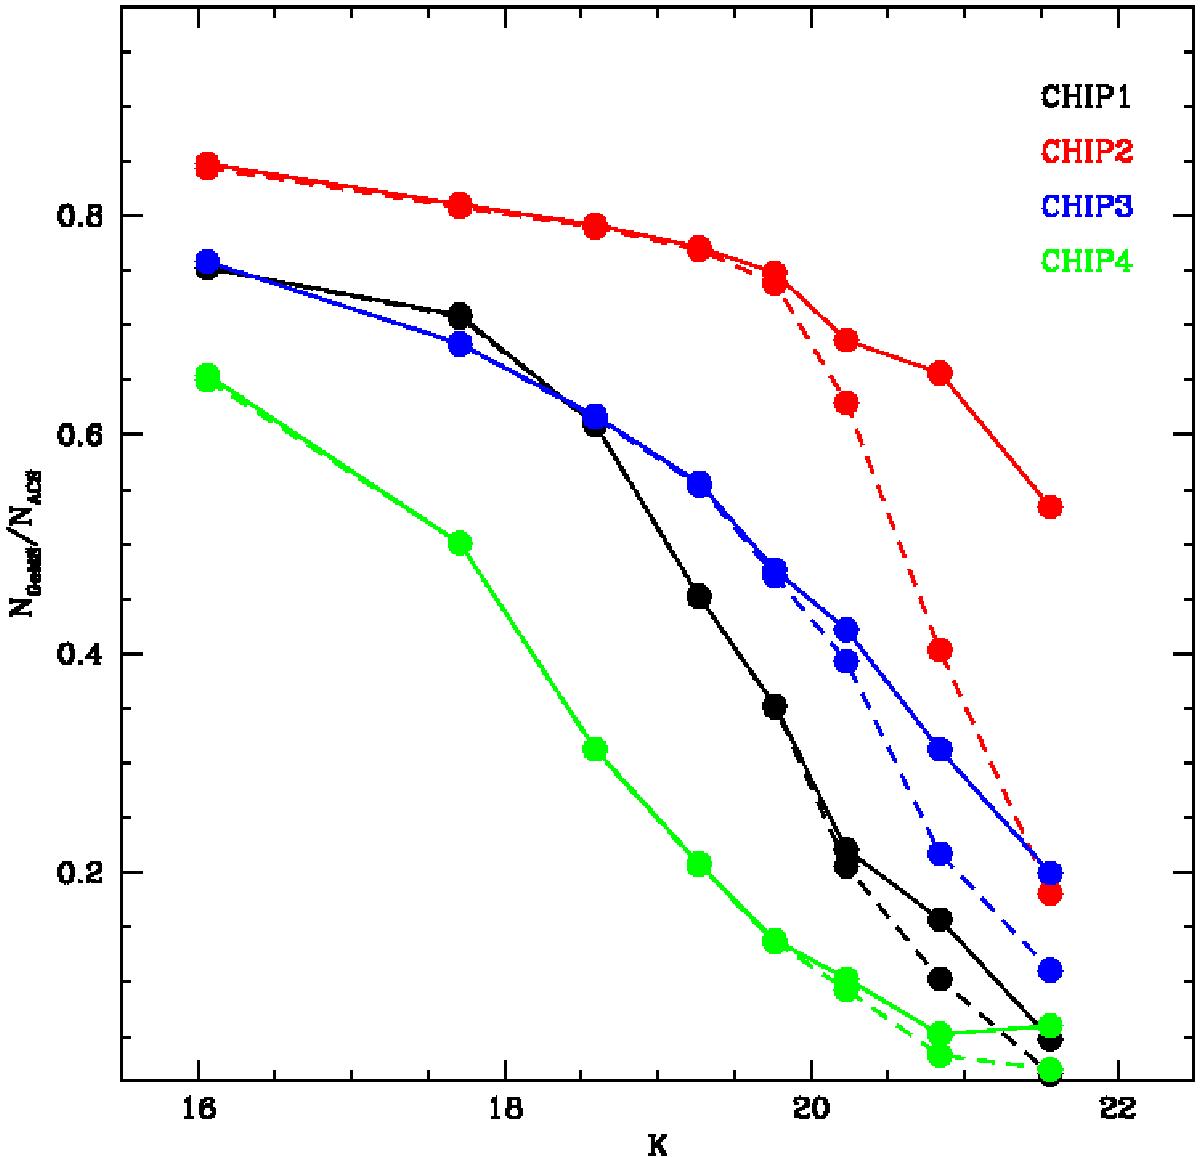
Completeness of our GeMS photometry relative to HST from the lower RGB down to the MS. Solid lines describe the trend for the K-band, dashed lines for the J-band. Each chip is shown with a different colour, and the best performing chip in both filters turned out to be chip2.
Current usage metrics show cumulative count of Article Views (full-text article views including HTML views, PDF and ePub downloads, according to the available data) and Abstracts Views on Vision4Press platform.
Data correspond to usage on the plateform after 2015. The current usage metrics is available 48-96 hours after online publication and is updated daily on week days.
Initial download of the metrics may take a while.