Fig. 6
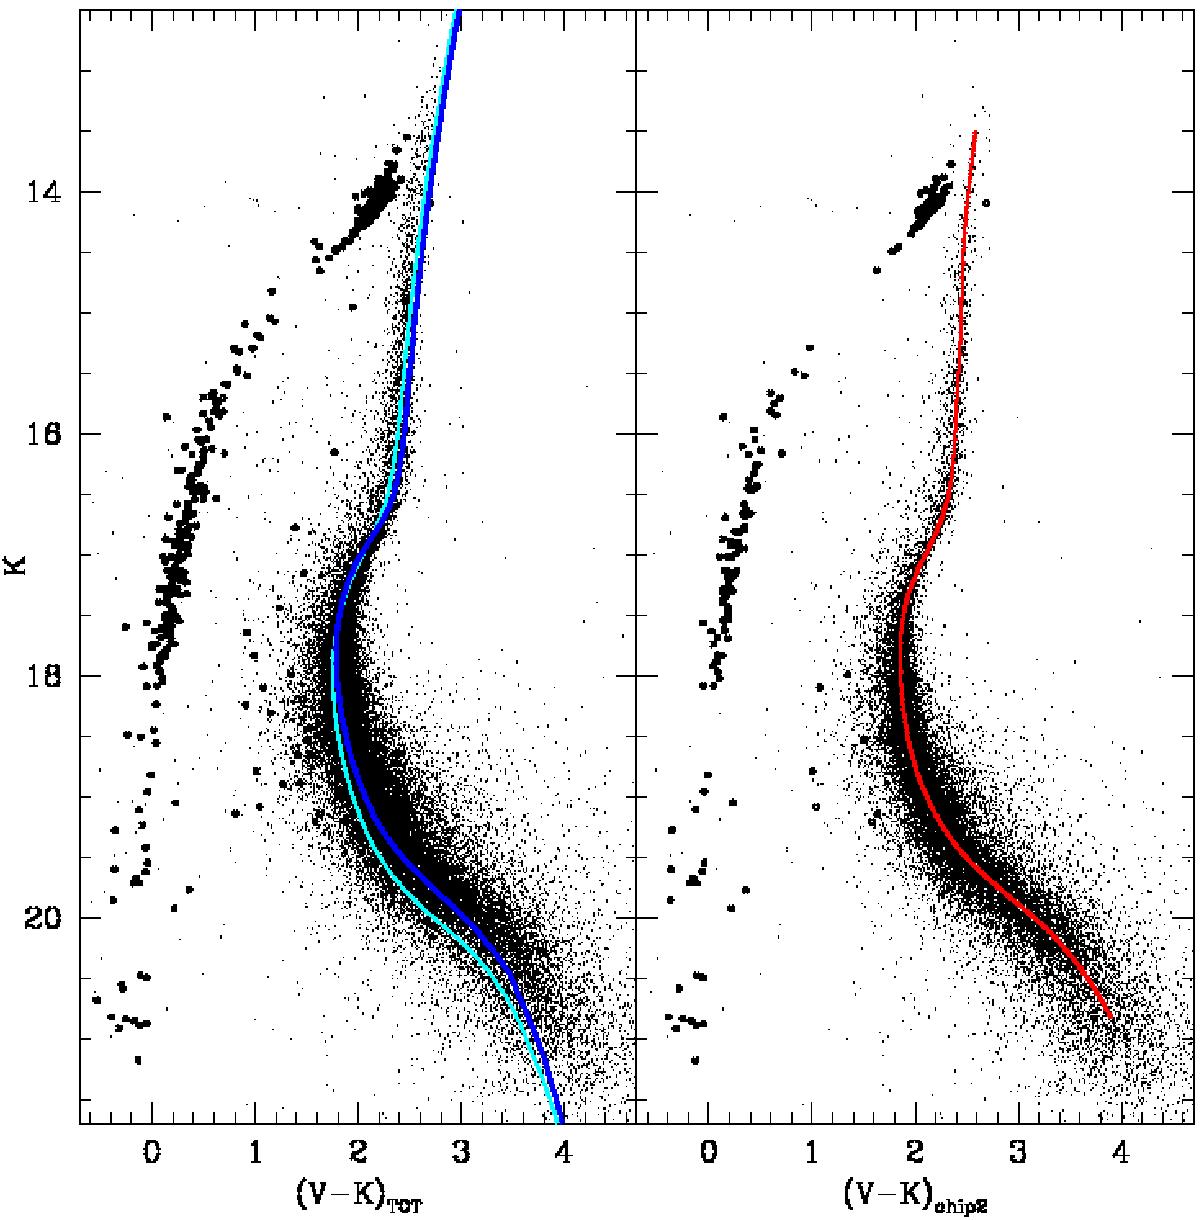
(K,V − K) CMD of NGC 2808 obtained from the combination of our GeMS photometry and the HST/ACS catalogue of (Sarajedini et al. 2007). The left panel shows the CMD of the entire GeMS sample, fit by a theoretical model taken from (VandenBerg et al. 2012). An Y-enhanced model (Y = 0.33) is also plotted in cyan for sake of comparison. The right panel shows only stars belonging to the best chip 2 and the corresponding ridge line is superimposed in red. HB stars are highlighted with thick symbols.
Current usage metrics show cumulative count of Article Views (full-text article views including HTML views, PDF and ePub downloads, according to the available data) and Abstracts Views on Vision4Press platform.
Data correspond to usage on the plateform after 2015. The current usage metrics is available 48-96 hours after online publication and is updated daily on week days.
Initial download of the metrics may take a while.