| Issue |
A&A
Volume 586, February 2016
|
|
|---|---|---|
| Article Number | A139 | |
| Number of page(s) | 15 | |
| Section | Catalogs and data | |
| DOI | https://doi.org/10.1051/0004-6361/201526345 | |
| Published online | 09 February 2016 | |
Planck intermediate results
XXXVI. Optical identification and redshifts of Planck SZ sources with telescopes at the Canary Islands observatories
1 APC, AstroParticule et Cosmologie, Université Paris Diderot, CNRS/IN2P3, CEA/lrfu, Observatoire de Paris, Sorbonne Paris Cité, 10 rue Alice Domon et Léonie Duquet, 75205 Paris Cedex 13, France
2 Aalto University Metsähovi Radio Observatory, PO Box 13000, 00076 Aalto, Finland
3 Academy of Sciences of Tatarstan, Bauman Str. 20, Kazan 420111, Republic of Tatarstan, Russia
4 African Institute for Mathematical Sciences, 6−8 Melrose Road, Muizenberg, 7945 Cape Town, South Africa
5 Agenzia Spaziale Italiana Science Data Center, via del Politecnico snc, 00133 Roma, Italy
6 Astrophysics Group, Cavendish Laboratory, University of Cambridge, J J Thomson Avenue, Cambridge CB3 0HE, UK
7 Astrophysics & Cosmology Research Unit, School of Mathematics, Statistics & Computer Science, University of KwaZulu-Natal, Westville Campus, Private Bag X54001, 4000 Durban, South Africa
8 Atacama Large Millimeter/submillimeter Array, ALMA Santiago Central Offices, Alonso de Cordova 3107, Vitacura, Casilla 763, 0355 Santiago, Chile
9 CGEE, SCS Qd 9, Lote C, Torre C, 4° andar, Ed. Parque Cidade Corporate, CEP 70308-200 Brasília, DF, Brazil
10 CITA, University of Toronto, 60 St. George St., Toronto, ON M5S 3H8, Canada
11 CNRS, IRAP, 9 Av. colonel Roche, BP 44346, 31028 Toulouse Cedex 4, France
12 California Institute of Technology, Pasadena, 1200E California, USA
13 Centro de Estudios de Física del Cosmos de Aragón (CEFCA), Plaza San Juan 1, planta 2, 44001 Teruel, Spain
14 Computational Cosmology Center, Lawrence Berkeley National Laboratory, Berkeley, California CA 94720, USA
15 Consejo Superior de Investigaciones Científicas (CSIC), 28006 Madrid, Spain
16 DSM/Irfu/SPP, CEA-Saclay, 91191 Gif-sur-Yvette Cedex, France
17 DTUSpace, National Space Institute, Technical University of Denmark, Elektrovej 327, 2800 Kgs. Lyngby, Denmark
18 Département de Physique Théorique, Université de Genève, 24 Quai E. Ansermet, 1211 Genève 4, Switzerland
19 Departamento de Astrofísica, Universidad de La Laguna (ULL), 38206 La Laguna, Tenerife, Spain
20 Departamento de Física, Universidad de Oviedo, Avda. Calvo Sotelo s/n, 33003 Oviedo, Spain
21 Department of Astronomy and Geodesy, Kazan Federal University, Kremlevskaya Str. 18, 420008 Kazan, Russia
22 Department of Astrophysics/IMAPP, Radboud University Nijmegen, PO Box 9010, 6500 GL Nijmegen, The Netherlands
23 Department of Physics & Astronomy, University of British Columbia, 6224 Agricultural Road, Vancouver, British Columbia, Canada
24 Department of Physics and Astronomy, Dana and David Dornsife College of Letter, Arts and Sciences, University of Southern California, Los Angeles, CA 90089, USA
25 Department of Physics and Astronomy, University College London, London WC1E 6BT, UK
26 Department of Physics, Florida State University, Keen Physics Building, 77 Chieftan Way, Tallahassee, Florida FL 32306, USA
27 Department of Physics, Gustaf Hällströmin katu 2a, University of Helsinki, 00100 Helsinki, Finland
28 Department of Physics, Princeton University, Princeton, New Jersey NJ 08540, USA
29 Department of Physics, University of California, Santa Barbara, California CA 93106, USA
30 Department of Physics, University of Illinois at Urbana-Champaign, 1110 West Green Street, Urbana, Illinois, USA
31 Dipartimento di Fisica e Astronomia G. Galilei, Università degli Studi di Padova, via Marzolo 8, 35131 Padova, Italy
32 Dipartimento di Fisica e Scienze della Terra, Università di Ferrara, via Saragat 1, 44122 Ferrara, Italy
33 Dipartimento di Fisica, Università La Sapienza, P.le A. Moro 2, 00185 Roma, Italy
34 Dipartimento di Fisica, Università degli Studi di Milano, via Celoria, 16, Milano, Italy
35 Dipartimento di Matematica, Università di Roma Tor Vergata, via della Ricerca Scientifica, 1, 00173 Roma, Italy
36 Discovery Center, Niels Bohr Institute, Blegdamsvej 17, Copenhagen, Denmark
37 Discovery Center, Niels Bohr Institute, Copenhagen University, Blegdamsvej 17, 2100 Copenhagen, Denmark
38 European Southern Observatory, ESO Vitacura, Alonso de Cordova 3107, Vitacura, Casilla 19001, Santiago, Chile
39 European Space Agency, ESAC, Planck Science Office, Camino bajo del Castillo s/n, Urbanización Villafranca del Castillo, 28692 Villanueva de la Cañada, Madrid, Spain
40 Facoltà di Ingegneria, Università degli Studi e-Campus, via Isimbardi 10, 22060 Novedrate (CO), Italy
41 Finnish Centre for Astronomy with ESO (FINCA), University of Turku, Väisäläntie 20, 21500 Piikkiö, Finland
42 Gran Sasso Science Institute, INFN, viale F. Crispi 7, 67100 L’ Aquila, Italy
43 HGSFP and University of Heidelberg, Theoretical Physics Department, Philosophenweg 16, 69120 Heidelberg, Germany
44 Helsinki Institute of Physics, Gustaf Hällströmin katu 2, University of Helsinki, 00100 Helsinki, Finland
45 INAF−Osservatorio Astronomico di Padova, Vicolo dell’Osservatorio 5, Padova, Italy
46 INAF−Osservatorio Astronomico di Roma, via di Frascati 33, Monte Porzio Catone, 00136 Roma, Italy
47 INAF−Osservatorio Astronomico di Trieste, via G.B. Tiepolo 11, 34131 Trieste, Italy
48 INAF/IASF Bologna, via Gobetti 101, Bologna, Italy
49 INAF/IASF Milano, via E. Bassini 15, Milano, Italy
50 INFN, Sezione di Bologna, via Irnerio 46, 40126 Bologna, Italy
51 INFN, Sezione di Roma 1, Università di Roma Sapienza, Piazzale Aldo Moro 2, 00185 Roma, Italy
52 INFN, Sezione di Roma 2, Università di Roma Tor Vergata, via della Ricerca Scientifica 1, 00185 Roma, Italy
53 Imperial College London, Astrophysics group, Blackett Laboratory, Prince Consort Road, London, SW7 2AZ, UK
54 Infrared Processing and Analysis Center, California Institute of Technology, Pasadena, CA 91125, USA
55 Institut Universitaire de France, 103 Bd Saint-Michel, 75005 Paris, France
56 Institut d’Astrophysique Spatiale, CNRS (UMR 8617), Université Paris-Sud 11, Bâtiment 121, Orsay, France
57 Institut d’Astrophysique de Paris, CNRS (UMR 7095), 98bis Boulevard Arago, 75014 Paris, France
58 Institute of Astronomy, University of Cambridge, Madingley Road, Cambridge CB3 0HA, UK
59 Institute of Theoretical Astrophysics, University of Oslo, Blindern, Oslo, Norway
60 Instituto Nacional de Astrofísica, Óptica y Electrónica (INAOE), Apartado Postal 51 y 216, 72000 Puebla, Mexico
61 Instituto de Astrofísica de Canarias, C/Vía Láctea s/n, La Laguna, Tenerife, Spain
62 Instituto de Física de Cantabria (CSIC-Universidad de Cantabria), Avda. de los Castros s/n, 39005 Santander, Spain
63 Istituto Nazionale di Fisica Nucleare, Sezione di Padova, via Marzolo 8, 35131 Padova, Italy
64 Jet Propulsion Laboratory, California Institute of Technology, 4800 Oak Grove Drive, Pasadena, California, USA
65 Jodrell Bank Centre for Astrophysics, Alan Turing Building, School of Physics and Astronomy, The University of Manchester, Oxford Road, Manchester, M13 9PL, UK
66 Kavli Institute for Cosmological Physics, University of Chicago, Chicago, IL 60637, USA
67 Kavli Institute for Cosmology Cambridge, Madingley Road, Cambridge, CB3 0HA, UK
68 Kazan Federal University, 18 Kremlyovskaya St., 420008 Kazan, Russia
69 LAL, Université Paris-Sud, CNRS/IN2P3, 91400 Orsay, France
70 LERMA, CNRS, Observatoire de Paris, 61 Avenue de l’Observatoire, Paris, France
71 Laboratoire AIM, IRFU/Service d’Astrophysique−CEA/DSM−CNRS−Université Paris Diderot, Bât. 709, CEA-Saclay, 91191 Gif-sur-Yvette Cedex, France
72 Laboratoire Traitement et Communication de l’Information, CNRS (UMR 5141) and Télécom ParisTech, 46 rue Barrault, 75634 Paris Cedex 13, France
73 Laboratoire de Physique Subatomique et Cosmologie, Université Grenoble-Alpes, CNRS/IN2P3, 53 rue des Martyrs, 38026 Grenoble Cedex, France
74 Laboratoire de Physique Théorique, Université Paris-Sud 11 & CNRS, Bâtiment 210, 91405 Orsay, France
75 Lawrence Berkeley National Laboratory, Berkeley, California, USA
76 Lebedev Physical Institute of the Russian Academy of Sciences, Astro Space Centre, 84/32 Profsoyuznaya st., GSP-7, Moscow 117997 Moscow, Russia
77 Max-Planck-Institut für Astrophysik, Karl-Schwarzschild-Str. 1, 85741 Garching, Germany
78 Max-Planck-Institut für Extraterrestrische Physik, Giessenbachstraße, 85748 Garching, Germany
79 Moscow Institute of Physics and Technology, Institutsky per., 9, 141700 Dolgoprudny, Russia
80 National University of Ireland, Department of Experimental Physics, Maynooth, Co. Kildare, Ireland
81 Nicolaus Copernicus Astronomical Center, Bartycka 18, 00-716 Warsaw, Poland
82 Niels Bohr Institute, Blegdamsvej 17, 2100 Copenhagen, Denmark
83 Niels Bohr Institute, Copenhagen University, Blegdamsvej 17, 2100 Copenhagen, Denmark
84 Optical Science Laboratory, University College London, Gower Street, London WC 1E 6 BT, UK
85 SISSA, Astrophysics Sector, via Bonomea 265, 34136 Trieste, Italy
86 School of Physics and Astronomy, Cardiff University, Queens Buildings, The Parade, Cardiff, CF24 3AA, UK
87 Sorbonne Université-UPMC, UMR 7095, Institut d’Astrophysique de Paris, 98bis Boulevard Arago, 75014 Paris, France
88 Space Research Institute (IKI), Russian Academy of Sciences, Profsoyuznaya Str, 84/32, 117997 Moscow, Russia
89 Space Sciences Laboratory,University of California, Berkeley, CA 94720 California, USA
90 Special Astrophysical Observatory, Russian Academy of Sciences, Nizhnij Arkhyz, Zelenchukskiy region, 369167 Karachai-Cherkessian Republic, Russia
91 Sub-Department of Astrophysics, University of Oxford, Keble Road, Oxford OX1 3RH, UK
92 TÜBİTAK National Observatory, Akdeniz University Campus, 07058 Antalya, Turkey
93 UPMC Univ Paris 06, UMR 7095, 98bis Boulevard Arago, 75014 Paris, France
94 Universidad Andrés Bello, Dpto. de Ciencias Físicas, Facultad de Ciencias Exactas, 8370134 Santiago de Chile, Chile
95 Université de Toulouse, UPS-OMP, IRAP, 31028 Toulouse Cedex 4, France
96 University of Granada, Departamento de Física Teórica y del Cosmos, Facultad de Ciencias, 18010 Granada, Spain
97 University of Granada, Instituto Carlos I de Física Teórica y Computacional, 18010 Granada, Spain
98 Warsaw University Observatory, Aleje Ujazdowskie 4, 00-478 Warszawa, Poland
99 European Space Agency, ESTEC, Keplerlaan 1, 2201 AZ Noordwijk, The Netherlands
Received: 17 April 2015
Accepted: 24 November 2015
Abstract
We present the results of approximately three years of observations of Planck Sunyaev-Zeldovich (SZ) sources with telescopes at the Canary Islands observatories as part of the general optical follow-up programme undertaken by the Planck Collaboration. In total, 78 SZ sources are discussed. Deep-imaging observations were obtained for most of these sources; spectroscopic observations in either in long-slit or multi-object modes were obtained for many. We effectively used 37.5 clear nights. We found optical counterparts for 73 of the 78 candidates. This sample includes 53 spectroscopic redshift determinations, 20 of them obtained with a multi-object spectroscopic mode. The sample contains new redshifts for 27 Planck clusters that were not included in the first Planck SZ source catalogue (PSZ1).
Key words: large-scale structure of Universe / galaxies: clusters: general / catalogs
Corresponding author: J. A. Rubiño-Martín, This email address is being protected from spambots. You need JavaScript enabled to view it.
© ESO, 2016
1. Introduction
The Sunyaev-Zeldovich (SZ) effect (Sunyaev & Zeldovich 1972) is a spectral distortion of the cosmic microwave background (CMB) that is generated by inverse Compton scattering of CMB photons off hot electrons. It can be used as a powerful cosmological probe, complementary to the information encoded in the CMB angular power spectrum (e.g. Birkinshaw 1999; Carlstrom et al. 2002; Planck Collaboration XX 2014; Planck Collaboration XXI 2014; Planck Collaboration XXIX 2014). The usual application of the SZ effect is the detection of galaxy clusters, which in the standard paradigm are manifested in the most massive halos that emerge in the cosmic web of the large-scale structure (e.g. Springel et al. 2005). These halos are multi-component systems, consisting of dark matter and baryons in several phases (e.g. Allen et al. 2011). Galaxy clusters are excellent cosmological probes, capable of testing cosmology in a variety of ways, and placing constraints on cosmological parameters such as the normalization of the matter spectrum, dark matter and dark energy densities, neutrino masses, and the equation of state of the dark energy (Vikhlinin et al. 2009; Henry et al. 2009; Mantz et al. 2010; Planck Collaboration XX 2014; Mantz et al. 2015; Planck Collaboration XXIV 2016). Of all galaxy clusters, the most massive ones are the most sensitive to the cosmology. However, in the cold dark matter (CDM) model, these most massive galaxy clusters are predicted to be very rare, and their abundance rapidly decreases with redshift (e.g. Springel et al. 2005). Observationally, therefore, they are best found by surveying the large volumes accessible with all-sky surveys.
In the past, such surveys have been conducted using either X-ray or optical observations. Examples of the former are the ROSAT All-Sky Survey (RASS) and the catalogues drawn from RASS (e.g. REFLEX Böhringer et al. 2001; NORAS Böhringer et al. 2000; or MACS Ebeling et al. 2001), which reach a maximum redshift of z ~ 0.5 with a few objects beyond. Examples of the latter include catalogues based on SDSS data (Koester et al. 2007; Wen et al. 2009, 2012; Hao et al. 2010; Szabo et al. 2011), which extend up to about the same redshift threshold. In the past few years, millimeter surveys have released the first sets of galaxy clusters discovered by means of the thermal SZ effect (e.g. Song et al. 2012; Reichardt et al. 2013; Hasselfield et al. 2013; Sifón et al. 2013).
The Planck1 satellite (Planck Collaboration I 2014) provided for the first time the possibility of detecting galaxy clusters through the SZ effect in a full sky survey (Planck Collaboration VIII 2011; Planck Collaboration XXIX 2014; Planck Collaboration XXVII 2016). However, as the SZ effect provides no redshift, dedicated follow-up programmes are required to make the resulting catalogues scientifically useful. Since 2010, the Planck Collaboration has undertaken an extensive follow-up programme to confirm SZ cluster candidates, first from intermediate versions of the Planck SZ catalogue (Planck Collaboration IX 2011; Planck Collaboration Int. I 2012; Planck Collaboration Int. IV 2013), and later with the first public SZ catalogue, named PSZ1 (Planck Collaboration XXIX 2014; Planck Collaboration XXXII 2015). The strategy of the follow-up programme is detailed in that PSZ1 paper.
In this paper, we describe the observations carried out with telescopes at the Canary Islands observatories (or the European Northern observatory, ENO2), which were used for the PSZ1 catalogue (Planck Collaboration XXIX 2014; Planck Collaboration XXXII 2015). This is the second companion paper to the PSZ1 that is based on optical follow-up observations. The first was based on observations with the Russian-Turkish 1.5 m telescope (RTT; Planck Collaboration Int. XXVI 2015). Clusters confirmed in that work and here are tabulated in Planck Collaboration XXVII (2016).
The paper is organized as follows. Sections 2−4 describe the Planck catalogue and cluster observing programme, the telescopes used in this paper, and the methods we used to analyse our data and identify clusters. Section 5 describes the observations and main results. In Sect. 6 we conclude.
2. Planck PSZ1 cluster sample
The first Planck catalogue of SZ sources (PSZ1; Planck Collaboration XXIX 2014; Planck Collaboration XXXII 2015) comprises 1227 objects detected by means of the SZ effect in the Planck all-sky maps of the first 15.5 months of observations. The method used to construct the PSZ1 catalogue is described in detail in Planck Collaboration XXIX (2014). In brief, cluster candidates are blindly detected using three different detection methods (MMF1, MMF3, and PwS), which were also used to construct the ESZ sample (Planck Collaboration VIII 2011). The PSZ1 catalogue contains all objects found by at least one of the methods with a signal-to-noise ratio (S/N) of 4.5 or greater.
It is important to recall here that the mean beam size of the HFI Planck maps extends from  at 100 GHz to
  at 857 GHz (see e.g. Planck Collaboration I 2014). However, the expected positional error for the whole PSZ1 sample is 2′ (Planck Collaboration XXIX 2014).
A detailed validation process (Planck Collaboration XXIX 2014) included the search for possible counterparts in the ROSAT All Sky Survey (RASS, Voges et al. 1999, 2000), the Sloan Digital Sky Survey (SDSS, DR8, Aihara et al. 2011), the WISE all-sky survey (Wright et al. 2010), and DSS3 images, as well as cross-correlations with optical, X-ray, and other SZ catalogues. Candidates without confirmation after these steps were sent to observing facilities for follow-up observations. This article is one of the companion papers to Planck Collaboration XXIX (2014) and the PSZ1 catalogue.
We finally note that the Planck Collaboration recently released its second catalogue of SZ sources (PSZ2; Planck Collaboration XXVII 2016). PSZ2 includes 22 confirmations that are common sources with the PSZ1 and are discussed in this paper.
3. Our follow-up observations
Table 1 lists the telescopes and instruments at the Canary Islands observatories that have been used for this paper: a) the Gran Telescopio Canarias (GTC), installed in the Spanish Observatorio del Roque de los Muchachos (ORM) of the Instituto de Astrofísica de Canarias (IAC), in the island of La Palma; b) the Isaac Newton Telescope and the William Herschel Telescope operated on the island of La Palma by the ISAAC Newton Group of Telescopes in the Spanish ORM of the IAC; c) the Italian Telescopio Nazionale Galileo (TNG) operated on the island of La Palma by the Fundación Galileo Galilei of the INAF (Istituto Nazionale di Astrofisica) at the Spanish ORM of the IAC; d) the Nordic Optical Telescope, jointly operated on the island of La Palma by Denmark, Finland, Iceland, Norway, and Sweden, in the Spanish ORM of the IAC; and e) the IAC80 telescope operated on the island of Tenerife by the IAC in the Spanish Observatorio del Teide. The observed targets were extracted from different internal versions of the Planck cluster catalogue before publication of the PSZ1. The main criterion for observing a certain target in a given right ascension range was the S/N of the Planck SZ detection. We also note that the lowest declination accessible from the Canary Islands at a reasonable airmass is − 20°. Targets with lower declinations are sent to other facilities in the Southern Hemisphere.
Telescopes and instruments used for the confirmation of the Planck newly-discovered clusters at the Canary Islands observatories.
For each cluster candidate, we performed an initial pre-screening of possible counterparts using the Digitized Sky Survey (DSS)4 and the SDSS5, if available. If a cluster counterpart was identified after this process, new imaging observations were not required. If SDSS spectroscopic observations were available for several cluster members, we can provide the spectroscopic redshift of the cluster. Otherwise, we included the cluster in our list of spectroscopic targets.
After a certain target was selected for imaging observations, it was examined in two steps with our follow-up strategy. First, we carried out photometric observations in at least three broadband Sloan filters (g′,r′,i′). In some particular cases, we also used a redder filter (either Sloan z′ or Gunn Z). Given the expected redshift distribution of the Planck SZ-detected clusters (see e.g. Planck Collaboration XXIX 2014), this filter set is sufficient to trace the 4000 Å break up to redshifts z = 0.8, even in cases where no z′-band data are available. Based on g′r′i′-colour combinations, it is possible to identify the cluster candidates and to measure photometric redshifts (see e.g. Lopes 2007). In a second step, these results were later consolidated using spectroscopic observations, either using long-slit or multi-object spectroscopy.
Most of the targets were included in the PSZ1 catalogue and are therefore identified with their corresponding name in this catalogue. Nevertheless, there are 11 confirmed targets that were not included in PSZ1, either because their S/N value is lower than 4.5 or because they were excluded by the detection mask used in the final catalogue.
3.1. Imaging observations
Imaging observations were taken in multiple observing runs between June 2010 and December 2012, during the Planck proprietary period, mainly with three instruments: the Wide-Field Camera (WFC) on the 2.5 m Isaac Newton Telescope (INT); the auxiliary-port camera (ACAM) at the 4.2 m William-Herschel Telescope; and CAMELOT, the optical camera at the 0.82 m telescope (IAC80). The observing time was obtained as part of the proposals for the Spanish Time Allocation Committee (CAT) time (semesters 2010A to 2012B), and an International Time Programme (ITP12-2), accepted by the International Scientific Committee of the Roque de los Muchachos (ORM, La Palma) and Teide (OT, Tenerife) observatories.
All fields were imaged with the g′, r′ and i′ Sloan filters; for a majority of fields, either Sloan z′ or Gunn Z images are also available. As we discuss below, our final analysis for photometric redshifts does not make use of the z′ band images.
The WFC at the INT is a mosaic camera of four 2 k × 4 k CCDs with a spatial scale of  pixel, resulting in a field of view of 34′ × 34′. The detector of ACAM at the WHT covers a circular field of about
  (with ~
 pixel), and CAMELOT at the IAC80 has a 2 k × 2 k chip with
  pixel spatial scale, corresponding to a
  field. A typical field size of 10′ is sufficiently large to cover the expected uncertainty in positions with respect to the nominal Planck coordinates for each target (Planck Collaboration XXIX 2014).
The total integration time was split into three separate exposures, with offsets between exposures of at least 10′′. This allowed us to efficiently correct for bad pixels and cosmic rays. The average exposure times were 3000 s, 1500 s, and 900 s per filter for IAC80, INT, and WHT, respectively, yielding typical completeness magnitudes (derived from the histograms of objects) in r′ band of 20.6, 21.8, and 22.6, and typical limit magnitudes of 21.8, 22.7, and 23.7 for IAC80, INT and WHT, respectively.
3.2. Spectroscopic observations
Spectroscopic observations were performed under an International Time Program (ITP6) of the ORM (reference ITP12-2) and other CAT runs between 2012 and 2013. The redshift information included in this paper was supplemented with spectroscopic observations of a second ITP program (reference ITP13-08). The data were mostly obtained with the 3.5 m TNG and the 10.4 m GTC telescopes, while some data were obtained with the 2.5 m INT and NOT telescopes in service mode. Multi-object spectroscopy mode (MOS) was used for all the observations at the TNG telescope and for some of the GTC observations. INT and NOT observations, as well as most of the GTC observing blocks, were made with long slits.
The instrument used at the TNG was DOLORES, which has a CCD of 2048 × 2048 pixels, with pixel size 13.5 μm and pixel scale  . We used the LR-B grism with a dispersion of 2.75 Å pixel-1 operating in the wavelength range 3000−8430 Å, together with
  slits, which led to a final resolution of R = 600. The typical exposure time was 3 × 1800 s per mask. On average, we placed 30–35 slits per mask. Wavelength calibration was obtained using Hg-Ne and He-Ne lamps, which allowed us to obtain a root-mean-square (rms) error lower than 0.1 Å pixel-1 over the whole wavelength range.
Most of the GTC spectra were obtained using the OSIRIS spectrograph in long-slit mode. OSIRIS is a double CCD (2048 × 4096 pixels) with a pixel size of 15 μm and  pixel scale. We used the R300B grism, which provides a dispersion of 5.2 Å pixel-1 (using 2 × 2 binning) operating in the wavelength range 4000−9000 Å, together with
  slits. This set-up produces a spectral resolution of R ~ 500. The typical exposure time was 3 × 1000 s per slit position, and wavelength calibration was obtained using Hg, Ne, and Ar lamps, which produced an accuracy of 0.2 Å pixel-1 in the whole wavelength range. For specific cases, we also used the MOS mode with OSIRIS to sample the galaxy population and velocity field of the clusters. We chose the same instrument set-up as in long-slit mode, that is, slitlets and the R300B grism. The MOS mode allows us to set about 35−40 slitlets per mask plus a minimum of five fiducial holes, which are used to correctly centre the mask in the field. Masks were designed using GTC pre-imaging for each field. Given that we previously obtained photometric information (we mainly considered colours for cluster candidates within the red-sequence and RGB colour composite images obtained by the combination of g′, r′, and i′-band images), the success rate was typically 50−60%, from which we could retrieve velocity estimates for a minimum of 15−20 cluster members per mask.
The INT and NOT telescopes were also used in service time, with the IDS and ALFOSC spectrographs in long-slit mode. We used IDS/INT with the R150V grism with a slit of  width, which gave a dispersion of 4.03 Å pixel-1 and a spectral resolution of R = 400. Similarly, we used ALFOSC/NOT with grism 4 (3.05 Å pixel-1) together with
  width (so, R = 550). We obtained data exposing 3 × 1800 s in both telescopes. In both cases we used Ne arcs, obtaining an rms of less than 0.1 Å pixel-1 across the full spectra
We also used the 4.2 m WHT telescope with the ACAM spectrograph in long-slit observing mode, which offers a 2000 × 2000 CCD with a plate scale of  per pixel. The spectroscopic set-up was configured with a volume phase holographic disperser (3.3 Å pixel-1) and a slit width of 1′′. This set-up produces a spectral coverage between 4000 and 9000 Å and a resolution of R ~ 400. We usually obtain spectra for the BCG and other few additional luminous galaxy members by using several slit orientations for each cluster. On average, we integrate about 2 × 1000 s per slit. Our spectra have S/N ~ 5–30, which allows us to estimate radial velocities with an accuracy of about 50–80 km s-1.
4. Data reduction, cluster identification, and redshift measurements
4.1. Imaging data
Optical images were reduced with standard routines running within IRAF7. The standard reduction includes flux and astrometric calibrations. For the latter, we used astrometry v0.388 (Lang et al. 2010). The flux calibration refers to SDSS and is based either on the observations of Landolt standard stars or, in the case of fields with SDSS coverage, on the photometric data of SDSS. In case of non-photometric nights, targets were calibrated in the following observing run or during service time at the Canary Islands Observatories.
Sources were detected using SExtractor (Bertin & Arnouts 1996) in single-image mode. Sources were independently detected in all bands with 1.5σ detection thresholds in the filtered maps, which corresponds to a S/N ~ 3 in at least ten connected pixels. All catalogues were then merged with a search radius of 2′′.
The detection limits were estimated by measuring the standard deviation of the flux in several thousand randomly distributed circular apertures of 3′′ diameter. None of the aperture positions lies within 3′′ of its closest neighbour or of sources that have a >3σ detection. We note that because of the poor quality of the point-spread function (PSF) determination for several observations, we did not apply any criteria for star/galaxy separation, but included all sources in our catalogues.
 |
Fig. 1 Two examples of spectra of early-type cluster members (previously selected as candidates in the photometric sample) obtained with the TNG/DOLORES (left panel) and GTC/OSIRIS (right panel). Dashed lines show the location of the main absoption features identified in the spectra. The vertical axes are given in arbitrary units. |
4.2. Cluster detection and photometric redshifts
Our method to identify the member galaxies in the galaxy cluster candidates and to derive the photometric redshifts is based on the cluster-red sequence (CRS) method by Gladders & Yee (2000). Colour cuts in (g′−r′) or (r′−i′) are combined with the spatial distribution of the full catalogue to search for possible candidates. We have modified this method with the empirical relations of Lopes (2007) for the photometric redshifts of galaxy clusters (see Sect. 4.2 in that paper) to obtain photometric redshift estimates for galaxy overdensities and to select the probable cluster members for spectroscopic follow-up observations. To first order, the photometric redshifts can be estimated with 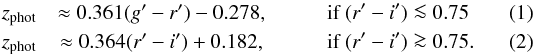 We compared this methodology with the photometric redshifts obtained with the BPZ code (Benítez 2000) and found that the two methods are fully consistent for the colour-selected galaxies in the cluster candidates.
After we applied our method to all candidates, the results were evaluated and consolidated with a careful inspection of the individual and RGB images and with the colour-magnitude diagrams. We found that the inspection by eye is particularly important to detect low-redshift systems, poor systems, fossil groups, or high-redshift systems, which usually are not easily detected by automatic algorithms searching for overdensities in colour space.
Our analysis shows that in most of the cases there is an obvious, rich overdensity of red galaxies in our follow-up imaging. In some cases we found two separate overdensities; for these, we obtained separate (photometric) redshifts, assuming that the spatial proximity can be a projection effect along the line of sight. These cases were investigated in detail using spectroscopic redshifts.
4.3. Spectroscopic data
We performed the data reduction of spectroscopic data using standard IRAF procedures. We did not correct for bias or flat fielding because we found after a careful check that the uncorrected spectra were less noisy than the corrected ones, probably because of the low brightness of the sources. The sky was evaluated locally for each spectrum; we used the median value in the external regions of each slit. Finally, we looked for possible deviations in the wavelength-calibrated spectra using the OI telluric line at 5577.3 Å. The mean error associated with this distortion of the instrument is 1 Å, equivalent to about 50 km s-1.
The long-slit observations were designed to maximize the number of redshift estimates, thus placing between two to four galaxies in the slit and retrieving exposures in two position angles for each cluster candidate. With this scheme, in some cases we obtained more than five redshifts for a single cluster using OSIRIS/GTC with only two slit orientations. Furthermore, we always obtained spectroscopic data of the apparent brightest cluster galaxy (BCG) of each candidate.
After the reduction steps, we obtained spectra with S/N of about 5 (per pixel, and around 6000 Å) for galaxies with magnitudes r′ ~ 20.8,20.5,19.7, and 21.7 with the WHT, TNG, INT/NOT, and GTC data, respectively. Figure 1 shows two examples of the obtained spectra.
The overall strategy was to use the GTC telescope to observe the most distant cluster candidates (at photometric redshifts zphot > 0.4), while WHT, INT, and NOT were used for the nearest ones (at zphot ≲ 0.4). We used TNG/MOS for clusters at intermediate redshift, 0.3 ≤ zphot ≤ 0.4. The MOS mode of OSIRIS at GTC was also used for a few galaxy clusters with confirmed redshifts above z = 0.5.
Radial velocities were obtained using the cross-correlation technique (Tonry & Davis 1979) implemented in the IRAF task RVSAO9. For each spectrum, the task performs a cross-correlation with six spectrum templates (Kennicutt 1992), each one corresponding to a different type of galaxy: E, S0, Sa, Sb, Sc, and Irr. The template with the highest R-value (a parameter given by XCSAO that measures the S/N of the cross-correlation peak) was chosen. In addition, we visually inspected all spectra to verify the velocity determination. In most cases, the redshift was obtained by using absorption lines. Nevertheless, in some special cases with low S/N spectra, emission lines were used to determine the redshift.
The TNG and GTC multi-object observations allowed us to obtain a larger sample of cluster members for each candidate (typically 15–20 members per cluster). For these systems we were therefore able to estimate a more accurate mean velocity, but also other physical magnitudes, like the velocity dispersion of candidates. In all the other cases, the cluster redshift was assumed to be that of the BCG (if observed). Otherwise, it was estimated from the mean velocity of the galaxy members.
Throughout this paper, galaxies are considered cluster members only if they present radial velocities within ± 2000 km s-1 with respect to the mean velocity of the systems. This velocity range represents about three times the typical velocity dispersion of a cluster. Hence, this criterium allows us to select a statistically significant number of cluster galaxies while minimizing the number of interlopers.
5. Results
The list of 67 clusters from the PSZ1 catalogue observed in this paper is given in Table 2. An additional set of 11 confirmed clusters not in the PSZ1 catalogue is given in Table 3. Fifty-three spectroscopic redshifts have been measured, 20 obtained with the MOS mode of TNG or GTC telescopes (i.e. with more than ten confirmed galaxy members). There are five SZ sources in the PSZ1 with no confirmed optical counterpart from our analyses (see discussion below) and 27 new redshifts that were not included in the original PSZ1 catalogue. Table 2 contains 15 targets that were also observed with the RTT150 and are discussed in Planck Collaboration Int. XXVI (2015). In both analyses, we found only one difference for a single cluster; this is discussed below. In addition, two targets (IDs 116 and 316 in Table 2) were also observed independently in the r and z bands with MegaCam at CFHT (van der Burg et al. 2016). Their photometric redshifts from the r−z red-sequence are consistent with our spectroscopic redshifts.
Clusters from the PSZ1 catalogue observed for this paper.
Confirmed clusters not in the PSZ1 catalogue observed for this paper.
Tables 2 and 3 provide the coordinates of the cluster optical centres calculated from the position of the BCG. If a BCG is not clearly identified or if two BCGs are found, the coordinates refer to the (approximate) geometrical centre of the cluster members. The distribution of the optical centre offsets relative to the SZ positions measured by Planck is shown in Fig. 2. Sixty-eight percent of the sample have a positional error smaller than  , consistent with (although slightly larger than) the expectation for the whole PSZ1 of 2′ (Planck Collaboration XXIX 2014). Figure 3 shows the distance of the cluster optical centres from the nominal Planck position as a function of redshift. For low-redshift systems (0.15 ≲ z ≲ 0.20), the characteristic scale of the virial radius of a cluster (here taken to be 1 Mpc) extends beyond 5′. In principle, associations between Planck SZ candidates and low-redshift optical counterparts with large apparent angular separations might therefore be expected. When we restrict the analysis in Fig. 2 to the sub-sample of clusters with redshifts above 0.2, the positional error is reduced to
  .
.
Figure 4 shows the comparison of our photometric redshift estimates (based on the method described in Sect. 4.2) with the corresponding spectroscopic redshifts for all targets in the PSZ1 catalogue described in Table 2. The scatter between the two estimates is δz/ (1 + z) = 0.025.
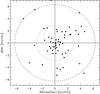 |
Fig. 2 Distribution of cluster optical centre offsets relative to their Planck SZ position. The dotted (dashed) line corresponds to a radius of |
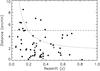 |
Fig. 3 Cluster optical centre offsets relative to their Planck SZ position as a function of cluster redshift. Open symbols correspond to photometric redshift determinations; filled dots are spectroscopic measurements. The dashed horizontal line at 5′ shows the maximum offset expected for a Planck SZ detection (i.e. a Planck beam). The dotted line corresponds to the angle subtended by 1 Mpc in projection at the corresponding redshift. |
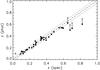 |
Fig. 4 Comparison of our photometric redshift estimates based on red-sequence colours with spectroscopic redshifts. The statistical error for the full sample is about 2.5%. For completeness, we also include as open symbols the few cases in which the photometric redshifts are derived from the SDSS database. |
We note that all sky images presented in this section are oriented with north up and east to the left.
5.1. Notes on individual objects from the PSZ1 catalogue
PSZ1 G031.91+67.94
There is no obvious identification within a distance of 5′ from the Planck SZ centre; however, the field is very rich in the surroundings. The Tempel et al. (2012) catalogue cited a few poor galaxy groups (29401, 29403, 29404, 28941, and 29795) and two large galaxy clusters (29405 at z = 0.134; 28941 at z = 0.039) within a distance of approximately 10′ from the Planck centre. Inspection of the Compton y-map in this area shows that none of the BCGs of these clusters corresponds to the main peak of the SZ emission. By inspecting a large area of about one square degree in the optical catalogs, we identify a clear peak in the galaxy density at 18′ from the Planck centre, which we list as the optical counterpart in Table 2. Using the current version of SDSS DR12, we found 54 spectroscopic members for this cluster over a region larger than 30′ at redshift z = 0.134 with σv ≈ 650 km s-1. There is no obvious BCG for this system, and it shows several galaxy clumps (possibly substructures) in the 2D galaxy distribution, each clump showing bright galaxies. A detailed dynamical study of this complex cluster is needed, and a more detailed study of the SZ emission, in combination with X-ray images, is required to confirm the proposed association. We note that one of the clumps of this cluster seems to be associated with GMBCG J217.49013+24.69973 (Hao et al. 2010), with zphot = 0.135.
PSZ1 G046.98+66.62
The proposed counterpart corresponds to the cluster WHL J143740.3+301200 (Wen et al. 2012), with zphot = 0.33. Our spectroscopic redshift is determined from SDSS data. Although the cluster is located  from the Planck centre, the Compton y-map (Planck Collaboration XXI 2014) supports this association, as did Liu et al. (2015).
PSZ1 G055.72+17.58
There are two possible identifications for this SZ source, both confirmed spectroscopically with the MOS at DOLORES/TNG (see Fig. 5 for details). The identification reported in Table 2 corresponds to a cluster with 24 spectroscopically confirmed members at z = 0.193. It is difficult to identify the BGC of this cluster because there are only a few galaxies with comparable magnitudes, given our error bars, therefore we provide the coordinates of the average position of all the spectroscopically confirmed members. This target was also identified in Planck Collaboration Int. XXVI (2015) as the optical counterpart of the SZ source. The Planck Compton y-map in this area (Planck Collaboration XXI 2014) supports this association. We found a second cluster in the region, less massive than the previous cluster, with 17 spectroscopically confirmed members at z = 0.070. Its BCG is at ( ,
,  ),
),  from the Planck centre.
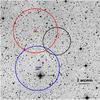 |
Fig. 5 DSS infrared image for the PSZ1 G055.72+17.58 source. The black circle shows the location of the Planck SZ centre with a 5′ diameter. Red and blue circles correspond to our confirmed clusters at z = 0.070 and z = 0.193, with 17 and 24 galaxy members, respectively. Small squares mark the BCG for each system. The SZ signal seems to be mainly associated with the southern cluster (inside the blue circle). |
PSZ1 G058.82−49.66
The proposed counterpart is a rich cluster located approximately 4′ from the Planck centre, with five spectroscopic members obtained with OSIRIS/GTC. The spectroscopic redshift of the BCG is z = 0.595. This counterpart is well-aligned with the signal found in the Compton y-map in this area (Planck Collaboration XXI 2014). In addition, our RGB image obtained with the WFC/INT data shows another overdensity of red galaxies, with photometric redshift zphot = 0.68. However, our OSIRIS/GTC observations in this second region are not conclusive. A long-slit observation including the apparent BCG ( ,
,  ) and two additional (photometrically selected) galaxies of this second cluster give a redshift of the BCG of z = 0.7069 ± 0.0003. Additional spectroscopic members need to be confirmed before this can be firmly established as a galaxy cluster.
PSZ1 G060.12+11.42
There is a clear galaxy cluster at zphot = 0.20. With DOLORES/TNG we confirm 18 spectroscopic members, and the redshift of the BCG is z = 0.224. There is also a clear arc seen in the RGB image (see Fig. 6).
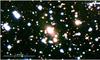 |
Fig. 6 RGB image of the cluster PSZ1 G060.12+11.42, obtained with the WFC/INT data. The white arrow shows the location of a gravitational arc. |
PSZ1 G076.44+23.53
This is a clear fossil group (e.g. Jones et al. 2003; Voevodkin et al. 2010). It is difficult to estimate the magnitude of the BGC because of the angular extension of the galaxy. Our photometric redshift estimate, based on colour selection of cluster members, is z = 0.17. With DOLORES/TNG, we confirm 21 spectroscopic members, and the redshift of the BCG is z = 0.168. This source was also included in the RTT150 sample (Planck Collaboration Int. XXVI 2015), and the spectroscopic redshift obtained there for the BGC is fully consistent with our value.
PSZ1 G078.67+20.06
Using WFC/INT, we identify a cluster with zphot = 0.49. The spectroscopic redshift for this cluster is z = 0.450, as obtained by the NOT telescope (Planck Collaboration XXIX 2014). The optical image clearly shows a gravitational arc around the BCG (see Fig. 7).
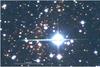 |
Fig. 7 RGB image of the cluster PSZ1 G078.67+20.06 obtained with our WFC/INT data. A gravitational arc (indicated by the arrow) is clearly visible around the cluster centre. |
PSZ1 G080.62−46.81
This is identified in NED/SIMBAD as RBS 1929 (RX J2301.1+0646), with a spectroscopic redshift of z = 0.042. Our photometric analysis, combined with SDSS photometry, gives a photometric redshift of z = 0.05.
PSZ1 G084.85+20.63
Using DOLORES/TNG, we confirm nine spectroscopic members for this cluster. The spectroscopic redshift provided in Table 2 of z = 0.367 corresponds to the BCG. However, there is a second galaxy with almost the same brightness in r′ that might be considered as a second BCG. The coordinates of this second galaxy are ( ,
,  ), and its redshift is z = 0.375.
PSZ1 G087.25−41.86
Fossil group, with a gap between the BGC and the second cluster member of more than 2 mag in r′. The spectroscopic redshift quoted in Table 2 corresponds to the BCG and was obtained from the SDSS database.
PSZ1 G091.82+26.11
The photometric redshift for this source was incorrectly estimated in the first version of the PSZ1 catalogue (Planck Collaboration XXIX 2014) (zphot = 0.24). Re-evaluation of the photometric redshift suggested that this probably is a z> 0.60 candidate, and this was later confirmed with spectroscopic observations using the MOS mode at OSIRIS/GTC. We have 18 spectrocopically confirmed members at z = 0.822. This cluster is part of the cosmological sample used in Planck Collaboration XX (2014).
PSZ1 G092.41−37.39
This system is classified as a fossil group with a double-nucleus BCG. The magnitude gap between the sum of the two fluxes of the central galaxies and the other members is larger than 2 mag in r′. The spectroscopic redshift was derived with OSIRIS/GTC. The cluster richness estimated from MegaCam imaging data suggests a low-mass system, as is also implied by the lack of any significant X-ray emission in the RASS maps (see also van der Burg et al. 2016).
PSZ1 G108.52+32.30
The optical counterpart is a poor system. Our photometric redshift estimate is zphot = 0.26 ± 0.02. A spectroscopic redshift with the NOT telescope of z = 0.250 was included in the PSZ1 catalogue and is fully consistent with our value.
PSZ1 G115.59−44.47
This target was included in the RTT150 sample (Planck Collaboration Int. XXVI 2015), but no counterpart was identified, in part due to possible contamination by Galactic cirrus. Inspection of the Compton y-map in this area (Planck Collaboration XXI 2014) shows an elongated structure with two peaks, but the detection might be contaminated by an unresolved source visible in the 217 GHz Planck map. One of the peaks corresponds to a possible galaxy cluster  from the Planck centre with a photometric redshift of zphot = 0.17. Firm confirmation of this optical cluster counterpart will require spectroscopic measurements.
PSZ1 G115.70+17.51
Our photometric redshift estimate for this cluster, which is quite extended and has much substructure, was zphot = 0.13. We performed MOS observations with DOLORES/TNG and found six spectroscopic members. The BCG is located at z = 0.111. This source was discussed in detail in Planck Collaboration Int. XXVI (2015), where a second possible red sequence of galaxies was identified in the background corresponding to a redshift of zphot = 0.5. Slits were placed at the location of four of these red galaxies in our MOS observations, but the derived redshifts are not coincident, and therefore we do not confirm the presence of that second cluster along the line of sight.
PSZ1 G118.06+31.10
Our photometric redshift estimate is zphot = 0.20 (ACAM/WHT). The spectroscopic redshift of the BCG is z = 0.194, and we have 14 additional members spectroscopically confirmed with DOLORES/TNG. This cluster was classified as a fossil group according to the criteria of Voevodkin et al. (2010) because the magnitude gap between the first and second brightest galaxies is Δm1,2 ≈ 1.8, within 0.5 Mpc of the BCG. Figure 8 shows the colour-magnitude diagram for this cluster. The red sequence in this case is given by (r−i) = 0.799−0.017r (Barrena et al. 2012).
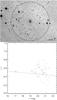 |
Fig. 8 PSZ1 G118.06+31.10, a galaxy cluster classified as fossil group following the definition of Voevodkin et al. (2010). Top: WFC/INT r′ band image of the cluster. The Planck pointing is shown with a small green circle, and the large circle has 5′ diameter. The BCG is also highlighted. Bottom: colour−magnitude diagram of the galaxies near the cluster centre. The squares indicate the spectroscopically confirmed members within 0.5 Mpc distance from the BCG. |
PSZ1 G123.55−10.34
The optical counterpart is  from the Planck centre. Our photometric redshift is zphot = 0.14 (WFC/INT) and the spectroscopic redshift of the BCG is z = 0.1027. We have 27 spectroscopically confirmed members with DOLORES/TNG. This is another fossil group, as Δm1,2> 2, although it is difficult to estimate the magnitude of the BGC because of its angular extension. This target was also included in the RTT150 paper (Planck Collaboration Int. XXVI 2015), with a spectroscopic redshift of z = 0.107.
PSZ1 G138.60−10.85
Figure 9 shows the RGB image obtained with the WFC/INT. The optical counterpart for this SZ target is from the Planck centre, and we obtained four spectroscopic members with OSIRIS/GTC. The redshift of the BCG is z = 0.702. As the galaxy members are very red and we lacked a Z -band image for this cluster, our original photometric redshift determination was quite uncertain (zphot> 0.53).
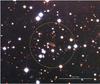 |
Fig. 9 RGB image of PSZ1 G138.60−10.85, obtained with the WFC/INT. The small white circles show the location of our four spectroscopically confirmed galaxies at z = 0.702 with OSIRIS/GTC. The yellow circle indicates the location of the cluster, and its diameter corresponds to 0.5 Mpc at that redshift. |
PSZ1 G146.00−49.42
Our WFC/INT image clearly shows Galactic cirrus contamination in the region. The proposed optical counterpart for this cluster is WHL J015128.7+104912, with zphot = 0.105 (Wen et al. 2012). Here we provide the spectroscopic confirmation, with four members at the same redshift from the SDSS database. The quoted value corresponds to the spectroscopic redshift of the BCG, z = 0.097. However, we note that the proposed BCG is a disk galaxy, showing clear signs of star formation (O ii, H α, and N ii emission lines). In addition, the magnitude gap among the three brightest galaxies is quite small (Δm1,2 = 0.2 and Δm2,3 = 0.2). We therefore provide for this case as the central coordinates of the cluster the centroid of the positions of ten photometrically selected members. This target was also observed with the RTT150 telescope (Planck Collaboration Int. XXVI 2015), but no counterpart was identified.
PSZ1 G153.41+36.58
There are two possible counterparts associated with this Planck SZ source (see Fig. 10). The first is a cluster spectroscopically confirmed at z = 0.650 (three spectroscopic members) with OSIRIS/GTC, at a distance of about 4′ from the Planck position. However, there is a second cluster with three galaxies spectroscopically confirmed at z = 0.825, but 4.9′ from the Planck position. In Table 2 we report as the optical counterpart the cluster that is closer to the Planck position; however, inspection of the Planck Compton y-map in this area (Planck Collaboration XXI 2014) shows an elongated structure that encompasses both clusters.
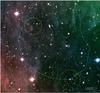 |
Fig. 10 RGB image of the cluster PSZ1 G153.41+36.58. The white circle shows the location of the Planck SZ centre. Small circles correspond to the locations of the spectroscopically confirmed clusters at z = 0.65 (green) and z = 0.825 (yellow). The light blue contours correspond to the 2.5 × 10⁻⁶ and 4 × 10⁻⁶ levels of the Compton y-map in this area (Planck Collaboration XXI 2014). |
PSZ1 G153.56+36.23
Using the SDSS database, we identified a low-redshift counterpart for this cluster,  from the nominal Planck position, with six spectroscopic members, all of them around z = 0.130. There is no clear BCG for this cluster. The image shows three large galaxies with similar r magnitudes (16.9−17.1). The coordinates in Table 2 correspond to the geometrical centroid of all photometrically selected members. A search in NED around this position yields two galaxy clusters: MaxBCG J129.79086+62.44628 with photometric redshift zphot = 0.146 (Koester et al. 2007), and GMBCG J129.95605+62.41001 with zphot = 0.168 (Hao et al. 2010). However, the proposed BCGs for these two photometrically selected clusters are indeed at the same spectroscopic redshift of z = 0.132, and therefore we conclude that they are all part of the same structure that we identify here. This target is only 22′ away from PSZ1 G153.41+36.58.
PSZ1 G153.87+41.05
Using the SDSS database, we identify a counterpart for this cluster 7′ from the Planck position, with a spectroscopic redshift of z = 0.279. Although this distance is unusually large, the Compton y-map in this area (Planck Collaboration XXI 2014) supports this association.
PSZ1 G165.76+31.15
All our redshift estimates for this candidate are based on SDSS data (both photometry and spectroscopy). In this region, we found two clusters overlapped in projection along the line of sight. The cluster reported in Table 2 corresponds to MaxBCG J119.49440+52.63797, a photometrically selected cluster with zphot = 0.30 (Koester et al. 2007), from the Planck position. Here we confirm this cluster spectroscopically, and we identified six spectroscopic members using SDSS data. The spectroscopic redshift of the central galaxy is z = 0.259. Nearby, we found a fossil group (Δm1,2 ≈ 2.5) at z = 0.041, with 13 spectroscopically confirmed members extracted from SDSS data. The BCG for this second cluster is at  ,
,  ), but the galaxy members are located throughout the region. This structure is classified as a group in Tempel et al. (2014), with reference GroupID = 1889.
PSZ1 G182.49−57.09
The proposed counterpart is a low-redshift cluster, with the BCG at z = 0.031, and with 37 spectroscopic members selected from SDSS. The cluster is spread over an area of approximately 1 deg2, which corresponds to a physical size of 2 Mpc at that redshift. The proposed BCG is 20′ from the Planck pointing.
PSZ1 G186.81+07.31
The SZ source was identified as WHL J97.3409+26.50 (Wen et al. 2012), with photometric redshift zphot = 0.258. Spectroscopic measurements of 18 members with the MOS at DOLORES/TNG give a redshift of z = 0.2204.
PSZ1 G204.24+14.51
This is a clear optical detection, identified as WHL J112.147+14.12 with a published photometric redshift of zphot = 0.355 (Wen et al. 2012). Here, we provide the spectroscopic confirmation of this cluster, observing two confirmed cluster members with the NOT telescope, and three additional members with the GTC. Our spectroscopic redshift for the BCG is z = 0.3454. Our optical image clearly shows several gravitational arcs around the BCG (see Fig. 11).
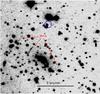 |
Fig. 11 WFC/INT i′ band image of the cluster PSZ1 G204.24+14.51. The blue circle shows the Planck PSZ1 position. Gravitational arcs (indicated by the red arrows) are clearly visible around the cluster centre. |
PSZ1 G206.52−26.37
The optical image (WFC/INT) shows strong extinction in the region, which might affect the photometric redshift estimate (see Fig. 12). The proposed optical counterpart has a photometric redshift of zphot = 0.36. The BCG is  from the Planck position, and its spectroscopic redshift, obtained with ACAM/WHT, is z = 0.391.
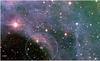 |
Fig. 12 RBG image of the cluster PSZ1 G206.52−26.37, obtained with the WFC/INT. The green circle marks the Planck PSZ1 position. Blue circles show the location of the proposed cluster and the BCG. |
PSZ1 G213.27+78.35
Two counterparts are identified for this SZ candidate. The cluster reported in Table 2 corresponds to GMBCG J179.84162+26.45111 (Hao et al. 2010), with photometric redshift zphot = 0.287. This cluster is also described in Liu et al. (2015), but the quoted photometric redshift was zphot = 0.316. Here, we provide the spectroscopic redshift of the cluster, using the information contained in the SDSS DR10 database10 for the BCG galaxy: z = 0.267. The BCG of this cluster is  from the Planck position. Using the same tool, we also found a second galaxy cluster in the same region. The BCG of this second cluster is at (
 ,
,  ), with a spectroscopic redshift of z = 0.139. We identified 28 spectroscopic members for this second cluster within 20′ of the BCG.
PSZ1 G249.01+73.75
The optical counterpart identified in Table 2 corresponds to a low-redshift cluster with two spectroscopically confirmed members at z = 0.156 using SDSS data. There are several red galaxies with similar brightness around ( ,
,  ) with consistent photometric redshifts. We provide this centroid as the coordinates for this cluster. The apparent BCG is located at (
 ,
,  ). This target is identied in NED as photometric cluster WHL J115659.6+165833 with zphot = 0.16 (Wen et al. 2012). There is another cluster in the region, WHL J115723.4+165903,
  from the Planck position. This cluster has zphot = 0.336 (Wen et al. 2009), and here we spectroscopically confirm two members at z = 0.358.
5.2. Non-detections from the PSZ1 catalogue
In five cases, our optical data are not sufficient to identify a counterpart of the Planck SZ source. In these cases, the most plausible explanations are either that there is no optical counterpart (i.e. a false SZ detection due to contamination by Galactic gas and dust emissions), or that the counterpart is at high redshift and our imaging is not deep enough. The first four cases were flagged as quality class 2 in the PSZ1 validation process (Planck Collaboration XXIX 2014) (meaning that they fulfil good-quality criteria for the SZ detection and for the associations and/or counterparts in ancillary data), while the last case is quality class 3 (low-reliability cluster candidate). We discuss these five cases in detail.
PSZ1 G105.91−38.39
There is no clear optical counterpart for this SZ source. Our imaging data were obtained with WFC/INT down to i′ = 25.6. The optical image shows several Galactic cirrus features and is strongly affected by extinction and a bright star near the centre (see Fig. 13). We found two overdensities of red objects. The first, 9′ from the Planck position, is unlikely to be associated with the SZ detection. The second is associated with WHL J235339.7+223928, a possible galaxy cluster at a zphot = 0.40, 6′ from the Planck position. However, long-slit observations with ACAM/WHT rule out this second case as a galaxy cluster because the red galaxies have very different redshifts. We note that this target has quality class 2 in the PSZ1 catalogue (Planck Collaboration XXIX 2014), and it is confirmed as a cluster by the Arcminute Microkelvin Imager (AMI; Perrott et al. 2015).
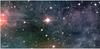 |
Fig. 13 RGB image of PSZ1 G105.91−38.39 obtained with the WFC/INT, centred around the Planck nominal coordinates for this target. This is an example of a Planck SZ source without a clear optical counterpart, probably due to the impact of extinction from Galactic cirrus and the bright star near the image centre. |
PSZ1 G115.34−54.89
No counterpart is identified in our WFC/INT imaging data down to i′ = 25. This target was also observed with the RTT150 (Planck Collaboration Int. XXVI 2015) and no cluster counterpart was found. A bright star close to the Planck centre might affect the optical identification.
PSZ1 G127.55+20.84
No counterpart is identified in our WFC/INT imaging data down to i′ = 24.8. The optical image shows several Galactic cirrus features and is strongly affected by extinction.
PSZ1 G167.43−38.04
No counterpart is identified in our WFC/INT imaging data down to i′ = 24.8. This target was also discussed in Planck Collaboration Int. XXVI (2015), with the same conclusion. The optical image shows Galactic cirrus contamination.
PSZ1 G194.68−49.73
This target was observed with the RTT150 (Planck Collaboration Int. XXVI 2015), and no counterpart was found. We obtained images with the WFC/INT and found a possible counterpart that we observed with OSIRIS/GTC. We confirmed two isolated red galaxies with the same spectroscopic redshift of z = 0.529, at  ,
,  ), ~4′ from the Planck position. However, there are no additional red objects in the surroundings with the same colours or redshifts. Therefore we do not quote this case as a detection, although these two objects might form a protocluster.
5.3. Notes on individual detections outside the PSZ1 catalogue
PLCK G128.38+71.18
This is a complicated case with four possible counterparts, two of which we confirmed spectroscopically as clusters. Figure 14 shows our 20′ × 10′ RGB image obtained with the WFC/INT. The counterpart listed in Table 3 corresponds to a system ~ from the Planck SZ position with 14 galaxies spectroscopically confirmed with DOLORES/TNG and a BCG z = 0.3367. This cluster is identified in NED as WHL J124204.5+454439 (Wen et al. 2012). Another cluster is ~
 from the Planck position, with BCG (redshift 0.5775) located at (
 ,
,  ), and ten spectroscopically confirmed members with DOLORES/TNG. We found two more possible clusters. One is listed in NED as WHL J124151.2+455301 and zphot = 0.4764 (Wen et al. 2012), but our spectroscopic observations with the MOS at DOLORES/TNG are not conclusive for this target. Of the 20 potential members of the cluster, we have only three almost coincident spectroscopic redshifts around z = 0.496. Thus, we cannot confirm this overdensity as a real cluster, which in case of confirmation would correspond to a poor group. The fourth overdensity of red objects in the region is associated with NSCS J124127+455030 in the NED database (Lopes et al. 2004). However, our MOS observations with DOLORES/TNG for this clump do not find coincident redshifts for the potential members, therefore this candidate does not seem to be a real cluster.
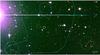 |
Fig. 14 RGB image of PLCK G128.38+71.18 obtained with the WFC/INT. The small white circle shows the Planck position. The yellow circle indicates our proposed counterpart, WHL J124204.5+454439, at a redshift of z = 0.3367. The green circle shows another cluster that we have spectroscopically confirmed, at z = 0.5775. The light blue contours correspond to the 2.5 × 10⁻⁶ and 4 × 10⁻⁶ levels of the Compton y-map in this area (Planck Collaboration XXI 2014). See text for details. |
PLCK G134.25−44.24
There are no clear counterparts within 5′ of the Planck coordinates, but there are two possible counterparts farther away. Taking into account the spatial distribution of the signal in the Compton y-map, we consider as the most probable candidate a low-redshift cluster located at ~ from the Planck position. This cluster has 4 spectroscopically confirmed members at ⟨ z ⟩ = 0.232, and more than 25 photometric members. In addition, there is a closer second candidate at (
 ,
,  ) with 6 spectroscopic members at ⟨ z ⟩ = 0.427. Further observations are needed to determine which cluster provides the larger contribution to the SZ signal.
PLCK G225.44+51.89
This is a very poor system  from the Planck position, with two galaxies spectroscopically confirmed at z = 0.297. There is no clear BCG, so we report the average central coordinate of all photometrically selected members. There is another group of galaxies
  to the south of the Planck position, with ten photometric members with zphot = 0.082. There is no evident BCG for this group, but there are seven spectroscopic determinations in SDSS, with a mean redshift of z = 0.084.
6. Conclusions
This article is a companion paper to the Planck catalogue of SZ sources (PSZ1) published in Planck Collaboration XXIX (2014). It contains the results of approximately three years of observations with telescopes at the Canary Islands observatories (IAC80, NOT, INT, TNG, WHT, and GTC), as part of the general optical follow-up programme undertaken by the Planck Collaboration.
In total, 78 SZ sources were discussed here. Deep-imaging observations were obtained for most; in many cases, spectroscopic observations were carried out either in long-slit or multi-object spectroscopic modes. We found optical counterparts for 73 of the 78 candidates. The confirmations include 53 spectroscopic redshift determinations, 20 of them obtained with a multi-object spectroscopic mode. Twenty-seven of these sources were not included in the first Planck SZ source catalogue (PSZ1) and are published here for the first time.
Table 2 contains five cases (out of 67) in which more than one possible cluster counterpart is identified along the line of sight of the SZ signal. Similar projection effects were also discussed in earlier works with a subsample of Planck clusters observed with XMM-Newton (Planck Collaboration Int. IV 2013) or with the RTT150 (Planck Collaboration Int. XXVI 2015). However, as discussed in detail in the RTT150 paper, the sub-sample of Planck SZ sources included in this work is not statistically representative in any sense. Sources were selected from different versions of the Planck SZ source catalogue during a two-year period, and after the PSZ1 catalogue was completed, observations were focused on the clusters without optical counterparts. It is therefore not possible to infer the statistical properties of the full PSZ1 sample (e.g. biases, fraction of false sources, fraction of sources with projections) using only the targets listed in Table 2. Any statistical analysis needs to be based on the full PSZ1 sample.
After this work, the current status of the PSZ1 validation, including all confirmed clusters, is summarized in Table 10 of Planck Collaboration XXVII (2016).
We emphasize the importance of using the Compton y-map (Planck Collaboration XXI 2014) as a tool to confirm the optical counterparts of some candidates. Here we discussed several cases (e.g. PSZ1 G046.98+66.62, PSZ1 G153.87+41.05) of clusters with anomalously large angular separations with respect to the nominal Planck SZ centre, but whose locations match the peak of the SZ emission in the y-map very well.
On-going (and future) follow-up programmes, some of them running in the facilites described in this paper, are expected to be able to complete the optical identification of Planck cluster candidates within a few years.
Planck (http://www.esa.int/Planck) is a project of the European Space Agency (ESA) with instruments provided by two scientific consortia funded by ESA member states and led by Principal Investigators from France and Italy, telescope reflectors provided through a collaboration between ESA and a scientific consortium led and funded by Denmark, and additional contributions from NASA (USA).
IRAF (http://iraf.noao.edu/) is distributed by the National Optical Astronomy Observatories, which are operated by the Association of Universities for Research in Astronomy, Inc., under cooperative agreement with the National Science Foundation.
RVSA was developed at the Smithsonian Astrophysical Observatory Telescope Data Center.
SkyServer DR10: http://skyserver.sdss.org/dr10/
Acknowledgments
The Planck Collaboration acknowledges the support of: ESA; CNES, and CNRS/INSU-IN2P3-INP (France); ASI, CNR, and INAF (Italy); NASA and DoE (USA); STFC and UKSA (UK); CSIC, MINECO, JA and RES (Spain); Tekes, AoF, and CSC (Finland); DLR and MPG (Germany); CSA (Canada); DTU Space (Denmark); SER/SSO (Switzerland); RCN (Norway); SFI (Ireland); FCT/MCTES (Portugal); ERC and PRACE (EU). A description of the Planck Collaboration and a list of its members, indicating which technical or scientific activities they have been involved in, can be found at http://www.cosmos.esa.int/web/planck/planck-collaboration. This article is based on observations made with a) the Gran Telescopio Canarias (GTC), installed in the Spanish Observatorio del Roque de los Muchachos (ORM) of the Instituto de Astrofísica de Canarias (IAC), in the island of La Palma; b) the Isaac Newton Telescope and the William Herschel Telescope operated on the island of La Palma by the ISAAC Newton Group of Telescopes in the Spanish ORM of the IAC; c) the italian Telescopio Nazionale Galileo (TNG) operated on the island of La Palma by the Fundación Galileo Galilei of the INAF (Istituto Nazionale di Astrofisica) at the Spanish ORM of the IAC; d) the Nordic Optical Telescope, operated on the island of La Palma jointly by Denmark, Finland, Iceland, Norway, and Sweden, in the Spanish ORM of the IAC; and e) the IAC80 telescope operated on the island of Tenerife by the IAC in the Spanish Observatorio del Teide. This research has been carried out with telescope time awarded by the CCI International Time Programme at the Canary Islands observatories (programmes ITP12-2 and ITP13-8). This research has made use of the following databases: the NED database, operated by the Jet Propulsion Laboratory, California Institute of Technology, under contract with NASA; SIMBAD, operated at CDS, Strasbourg, France; the SZ-Cluster Database operated by the Integrated Data and Operation Center (IDOC) at the IAS under contract with CNES and CNRS; and the SDSS. Funding for the Sloan Digital Sky Survey (SDSS) has been provided by the Alfred P. Sloan Foundation, the Participating Institutions, the National Aeronautics and Space Administration, the National Science Foundation, the US Department of Energy, the Japanese Monbukagakusho, and the Max Planck Society. A.S., R.B., H.L., and J.A.R.M. acknowledge financial support from the Spanish Ministry of Economy and Competitiveness (MINECO) under the 2011 Severo Ochoa Program MINECO SEV-2011-0187, and the Consolider-Ingenio project CSD2010-00064 (EPI: Exploring the Physics of Inflation).
References
- Aihara, H., Allen de Prieto, C., An, D., et al. 2011, ApJS, 193, 29 [NASA ADS] [CrossRef] [Google Scholar]
- Allen, S. W., Evrard, A. E., & Mantz, A. B. 2011, ARA&A, 49, 409 [NASA ADS] [CrossRef] [Google Scholar]
- Barrena, R., Girardi, M., Boschin, W., & Mardirossian, F. 2012, A&A, 540, A90 [NASA ADS] [CrossRef] [EDP Sciences] [Google Scholar]
- Benítez, N. 2000, ApJ, 536, 571 [NASA ADS] [CrossRef] [Google Scholar]
- Bertin, E., & Arnouts, S. 1996, A&AS, 117, 393 [NASA ADS] [CrossRef] [EDP Sciences] [Google Scholar]
- Birkinshaw, M. 1999, Phys. Rep., 310, 97 [NASA ADS] [CrossRef] [Google Scholar]
- Böhringer, H., Voges, W., Huchra, J. P., et al. 2000, ApJS, 129, 435 [NASA ADS] [CrossRef] [Google Scholar]
- Böhringer, H., Schuecker, P., Guzzo, L., et al. 2001, A&A, 369, 826 [NASA ADS] [CrossRef] [EDP Sciences] [Google Scholar]
- Carlstrom, J. E., Holder, G. P., & Reese, E. D. 2002, ARA&A, 40, 643 [NASA ADS] [CrossRef] [Google Scholar]
- Ebeling, H., Edge, A. C., & Henry, J. P. 2001, ApJ, 553, 668 [Google Scholar]
- Gladders, M. D., & Yee, H. K. C. 2000, AJ, 120, 2148 [NASA ADS] [CrossRef] [Google Scholar]
- Hao, J., McKay, T. A., Koester, B. P., et al. 2010, ApJS, 191, 254 [NASA ADS] [CrossRef] [Google Scholar]
- Hasselfield, M., Hilton, M., Marriage, T. A., et al. 2013, J. Cosmol. Astropart. Phys., 7, 8 [Google Scholar]
- Henry, J. P., Evrard, A. E., Hoekstra, H., Babul, A., & Mahdavi, A. 2009, ApJ, 691, 1307 [NASA ADS] [CrossRef] [Google Scholar]
- Jones, L. R., Ponman, T. J., Horton, A., et al. 2003, MNRAS, 343, 627 [NASA ADS] [CrossRef] [Google Scholar]
- Kennicutt, Jr., R. C. 1992, ApJS, 79, 255 [NASA ADS] [CrossRef] [Google Scholar]
- Koester, B. P., McKay, T. A., Annis, J., et al. 2007, ApJ, 660, 239 [NASA ADS] [CrossRef] [Google Scholar]
- Lang, D., Hogg, D. W., Mierle, K., Blanton, M., & Roweis, S. 2010, AJ, 139, 1782 [Google Scholar]
- Liu, J., Hennig, C., Desai, S., et al. 2015, MNRAS, 449, 3370 [NASA ADS] [CrossRef] [Google Scholar]
- Lopes, P. A. A. 2007, MNRAS, 380, 1608 [NASA ADS] [CrossRef] [Google Scholar]
- Lopes, P. A. A., de Carvalho, R. R., Gal, R. R., et al. 2004, AJ, 128, 1017 [NASA ADS] [CrossRef] [Google Scholar]
- Mantz, A., Allen, S. W., Rapetti, D., & Ebeling, H. 2010, MNRAS, 406, 1759 [NASA ADS] [Google Scholar]
- Mantz, A. B., von der Linden, A., Allen, S. W., et al. 2015, MNRAS, 446, 2205 [NASA ADS] [CrossRef] [Google Scholar]
- Perrott, Y. C., Olamaie, M., Rumsey, C., et al. 2015, A&A, 580, A95 [NASA ADS] [CrossRef] [EDP Sciences] [Google Scholar]
- Planck Collaboration VIII. 2011, A&A, 536, A8 [NASA ADS] [CrossRef] [EDP Sciences] [Google Scholar]
- Planck Collaboration IX. 2011, A&A, 536, A9 [NASA ADS] [CrossRef] [EDP Sciences] [Google Scholar]
- Planck Collaboration Int. I. 2012, A&A, 543, A102 [NASA ADS] [CrossRef] [EDP Sciences] [Google Scholar]
- Planck Collaboration Int. IV. 2013, A&A, 550, A130 [NASA ADS] [CrossRef] [EDP Sciences] [Google Scholar]
- Planck Collaboration I. 2014, A&A, 571, A1 [NASA ADS] [CrossRef] [EDP Sciences] [Google Scholar]
- Planck Collaboration XX. 2014, A&A, 571, A20 [NASA ADS] [CrossRef] [EDP Sciences] [Google Scholar]
- Planck Collaboration XXI. 2014, A&A, 571, A21 [NASA ADS] [CrossRef] [EDP Sciences] [Google Scholar]
- Planck Collaboration XXIX. 2014, A&A, 571, A29 [NASA ADS] [CrossRef] [EDP Sciences] [Google Scholar]
- Planck Collaboration XXXII. 2015, A&A, 581, A14 [NASA ADS] [CrossRef] [EDP Sciences] [Google Scholar]
- Planck Collaboration Int. XXVI. 2015, A&A, 582, A29 [NASA ADS] [CrossRef] [EDP Sciences] [Google Scholar]
- Planck Collaboration XXIV. 2016, A&A, submitted [arXiv:1502.01597] [Google Scholar]
- Planck Collaboration XXVII. 2016, A&A, in press DOI: 10.1051/0004-6361/201525823 [Google Scholar]
- Reichardt, C. L., Stalder, B., Bleem, L. E., et al. 2013, ApJ, 763, 127 [NASA ADS] [CrossRef] [Google Scholar]
- Sifón, C., Menanteau, F., Hasselfield, M., et al. 2013, ApJ, 772, 25 [NASA ADS] [CrossRef] [Google Scholar]
- Song, J., Zenteno, A., Stalder, B., et al. 2012, ApJ, 761, 22 [NASA ADS] [CrossRef] [Google Scholar]
- Springel, V., White, S. D. M., Jenkins, A., et al. 2005, Nature, 435, 629 [NASA ADS] [CrossRef] [PubMed] [Google Scholar]
- Sunyaev, R. A., & Zeldovich, Y. B. 1972, Comments Astrophys. Space Phys., 4, 173 [NASA ADS] [EDP Sciences] [Google Scholar]
- Szabo, T., Pierpaoli, E., Dong, F., Pipino, A., & Gunn, J. 2011, ApJ, 736, 21 [NASA ADS] [CrossRef] [Google Scholar]
- Tempel, E., Tago, E., & Liivamägi, L. J. 2012, A&A, 540, A106 [NASA ADS] [CrossRef] [EDP Sciences] [Google Scholar]
- Tempel, E., Tamm, A., Gramann, M., et al. 2014, A&A, 566, A1 [NASA ADS] [CrossRef] [EDP Sciences] [Google Scholar]
- Tonry, J., & Davis, M. 1979, AJ, 84, 1511 [NASA ADS] [CrossRef] [Google Scholar]
- van der Burg, R. F. J., Aussel, H., Pratt, G. W., et al. 2016, A&A, in press, DOI: 10.1051/0004-6361/201527299 [Google Scholar]
- Vikhlinin, A., Kravtsov, A. V., Burenin, R. A., et al. 2009, ApJ, 692, 1060 [NASA ADS] [CrossRef] [Google Scholar]
- Voevodkin, A., Borozdin, K., Heitmann, K., et al. 2010, ApJ, 708, 1376 [NASA ADS] [CrossRef] [Google Scholar]
- Voges, W., Aschenbach, B., Boller, T., et al. 1999, A&A, 349, 389 [NASA ADS] [Google Scholar]
- Voges, W., Aschenbach, B., Boller, T., et al. 2000, IAU Circ., 7432, 3 [NASA ADS] [Google Scholar]
- Wen, Z. L., Han, J. L., & Liu, F. S. 2009, ApJS, 183, 197 [NASA ADS] [CrossRef] [Google Scholar]
- Wen, Z. L., Han, J. L., & Liu, F. S. 2012, ApJS, 199, 34 [NASA ADS] [CrossRef] [Google Scholar]
- Wright, E. L., Eisenhardt, P. R. M., Mainzer, A. K., et al. 2010, AJ, 140, 1868 [NASA ADS] [CrossRef] [Google Scholar]
All Tables
Telescopes and instruments used for the confirmation of the Planck newly-discovered clusters at the Canary Islands observatories.
All Figures
|
Fig. 1 Two examples of spectra of early-type cluster members (previously selected as candidates in the photometric sample) obtained with the TNG/DOLORES (left panel) and GTC/OSIRIS (right panel). Dashed lines show the location of the main absoption features identified in the spectra. The vertical axes are given in arbitrary units. |
| In the text | |
|
Fig. 2 Distribution of cluster optical centre offsets relative to their Planck SZ position. The dotted (dashed) line corresponds to a radius of |
| In the text | |
|
Fig. 3 Cluster optical centre offsets relative to their Planck SZ position as a function of cluster redshift. Open symbols correspond to photometric redshift determinations; filled dots are spectroscopic measurements. The dashed horizontal line at 5′ shows the maximum offset expected for a Planck SZ detection (i.e. a Planck beam). The dotted line corresponds to the angle subtended by 1 Mpc in projection at the corresponding redshift. |
| In the text | |
|
Fig. 4 Comparison of our photometric redshift estimates based on red-sequence colours with spectroscopic redshifts. The statistical error for the full sample is about 2.5%. For completeness, we also include as open symbols the few cases in which the photometric redshifts are derived from the SDSS database. |
| In the text | |
|
Fig. 5 DSS infrared image for the PSZ1 G055.72+17.58 source. The black circle shows the location of the Planck SZ centre with a 5′ diameter. Red and blue circles correspond to our confirmed clusters at z = 0.070 and z = 0.193, with 17 and 24 galaxy members, respectively. Small squares mark the BCG for each system. The SZ signal seems to be mainly associated with the southern cluster (inside the blue circle). |
| In the text | |
|
Fig. 6 RGB image of the cluster PSZ1 G060.12+11.42, obtained with the WFC/INT data. The white arrow shows the location of a gravitational arc. |
| In the text | |
|
Fig. 7 RGB image of the cluster PSZ1 G078.67+20.06 obtained with our WFC/INT data. A gravitational arc (indicated by the arrow) is clearly visible around the cluster centre. |
| In the text | |
|
Fig. 8 PSZ1 G118.06+31.10, a galaxy cluster classified as fossil group following the definition of Voevodkin et al. (2010). Top: WFC/INT r′ band image of the cluster. The Planck pointing is shown with a small green circle, and the large circle has 5′ diameter. The BCG is also highlighted. Bottom: colour−magnitude diagram of the galaxies near the cluster centre. The squares indicate the spectroscopically confirmed members within 0.5 Mpc distance from the BCG. |
| In the text | |
|
Fig. 9 RGB image of PSZ1 G138.60−10.85, obtained with the WFC/INT. The small white circles show the location of our four spectroscopically confirmed galaxies at z = 0.702 with OSIRIS/GTC. The yellow circle indicates the location of the cluster, and its diameter corresponds to 0.5 Mpc at that redshift. |
| In the text | |
|
Fig. 10 RGB image of the cluster PSZ1 G153.41+36.58. The white circle shows the location of the Planck SZ centre. Small circles correspond to the locations of the spectroscopically confirmed clusters at z = 0.65 (green) and z = 0.825 (yellow). The light blue contours correspond to the 2.5 × 10⁻⁶ and 4 × 10⁻⁶ levels of the Compton y-map in this area (Planck Collaboration XXI 2014). |
| In the text | |
|
Fig. 11 WFC/INT i′ band image of the cluster PSZ1 G204.24+14.51. The blue circle shows the Planck PSZ1 position. Gravitational arcs (indicated by the red arrows) are clearly visible around the cluster centre. |
| In the text | |
|
Fig. 12 RBG image of the cluster PSZ1 G206.52−26.37, obtained with the WFC/INT. The green circle marks the Planck PSZ1 position. Blue circles show the location of the proposed cluster and the BCG. |
| In the text | |
|
Fig. 13 RGB image of PSZ1 G105.91−38.39 obtained with the WFC/INT, centred around the Planck nominal coordinates for this target. This is an example of a Planck SZ source without a clear optical counterpart, probably due to the impact of extinction from Galactic cirrus and the bright star near the image centre. |
| In the text | |
|
Fig. 14 RGB image of PLCK G128.38+71.18 obtained with the WFC/INT. The small white circle shows the Planck position. The yellow circle indicates our proposed counterpart, WHL J124204.5+454439, at a redshift of z = 0.3367. The green circle shows another cluster that we have spectroscopically confirmed, at z = 0.5775. The light blue contours correspond to the 2.5 × 10⁻⁶ and 4 × 10⁻⁶ levels of the Compton y-map in this area (Planck Collaboration XXI 2014). See text for details. |
| In the text | |
Current usage metrics show cumulative count of Article Views (full-text article views including HTML views, PDF and ePub downloads, according to the available data) and Abstracts Views on Vision4Press platform.
Data correspond to usage on the plateform after 2015. The current usage metrics is available 48-96 hours after online publication and is updated daily on week days.
Initial download of the metrics may take a while.